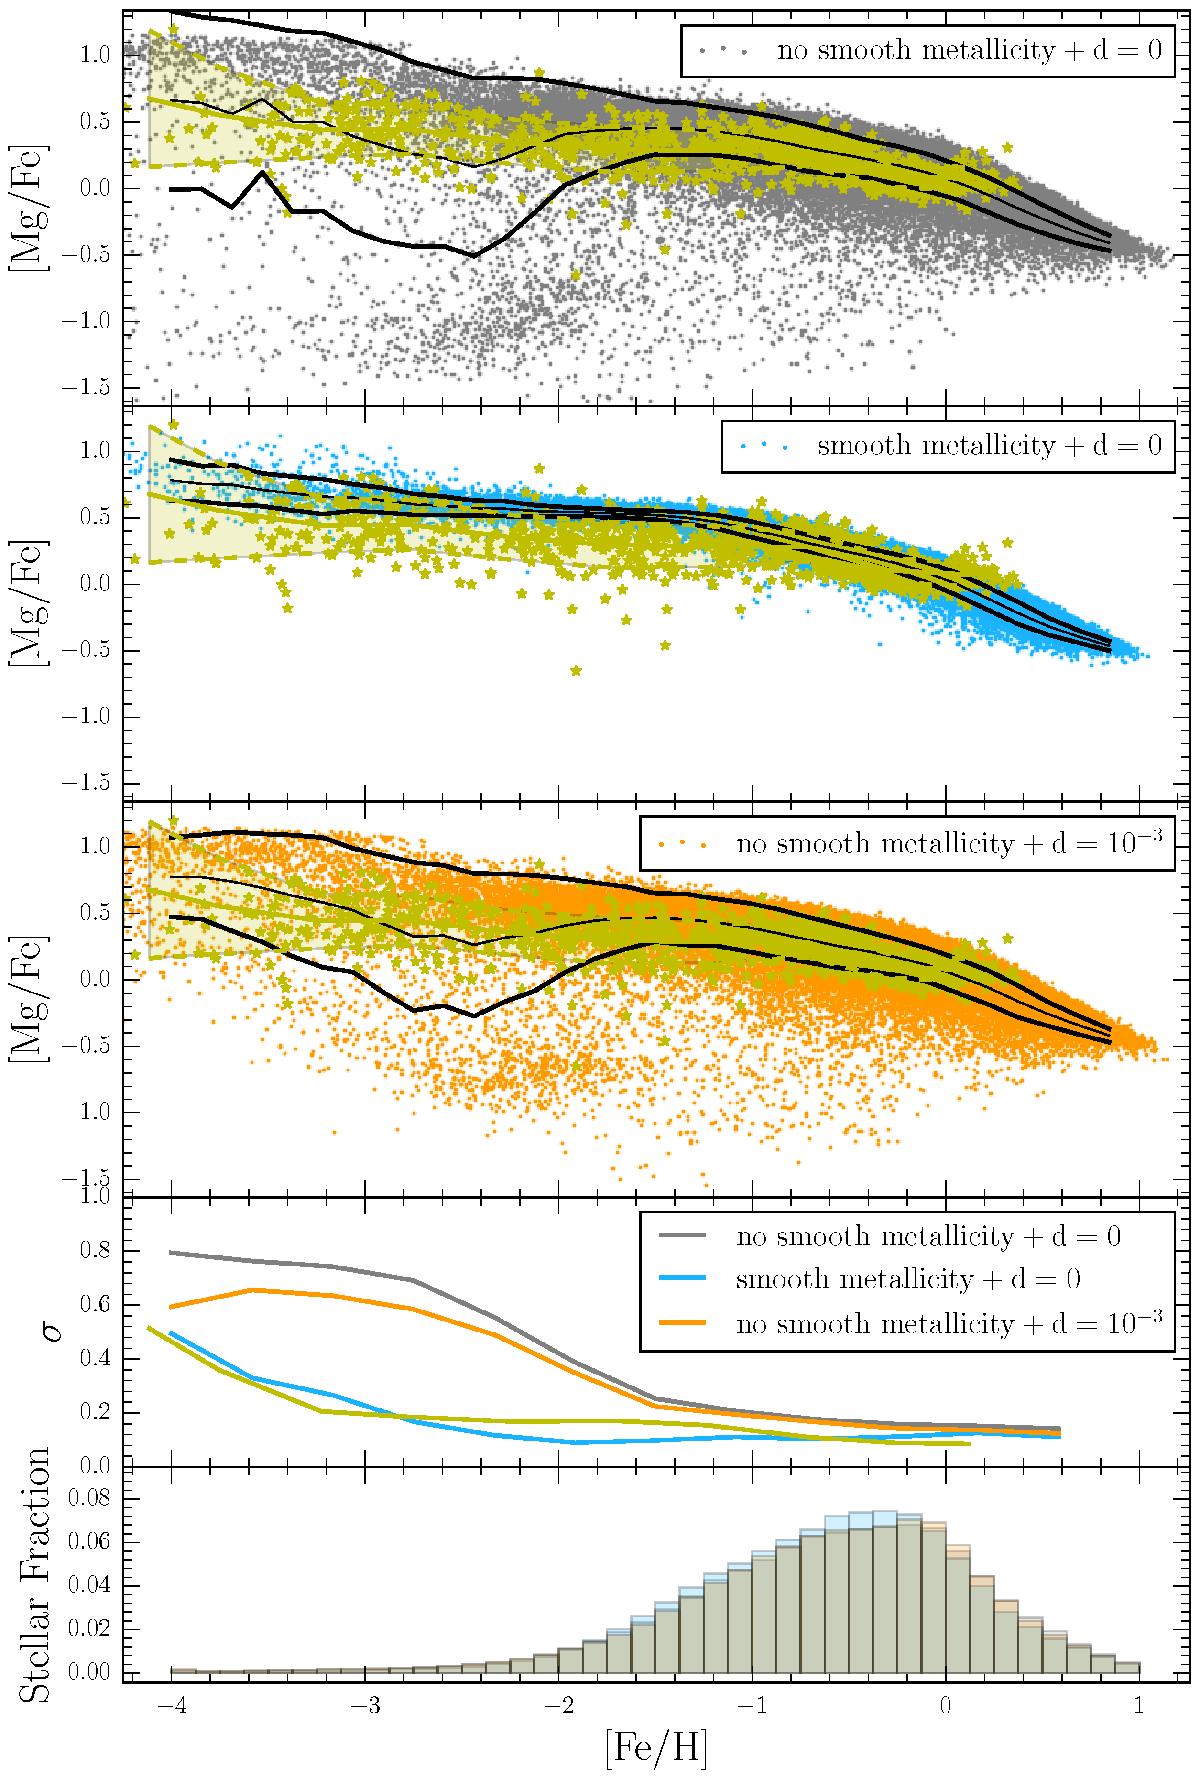
Fig. 18

Comparison of the final [Mg/Fe] stellar dispersion of the three Milky Way-like models. In the top three panels, the points correspond to the [Mg/Fe] and [Fe/H] values of each stellar particle. The black curves show the 1σ dispersion around the mean [Mg/Fe]. Those values are also reported in the fourth panel for a direct comparison. The bottom panel shows the metallicity distribution function of the three models. In each plot, the yellow points and curves correspond to the observational values of Milky Way stars only, taken from Fig. 1 (Cayrel et al. 2004; Gratton et al. 2003; Venn et al. 2004; Gehren et al. 2006; Reddy et al. 2006; Andrievsky et al. 2010; Cohen et al. 2013). The yellow dashed region corresponds to the observation 1σ dispersion.
Current usage metrics show cumulative count of Article Views (full-text article views including HTML views, PDF and ePub downloads, according to the available data) and Abstracts Views on Vision4Press platform.
Data correspond to usage on the plateform after 2015. The current usage metrics is available 48-96 hours after online publication and is updated daily on week days.
Initial download of the metrics may take a while.


