Free Access
Fig. 16
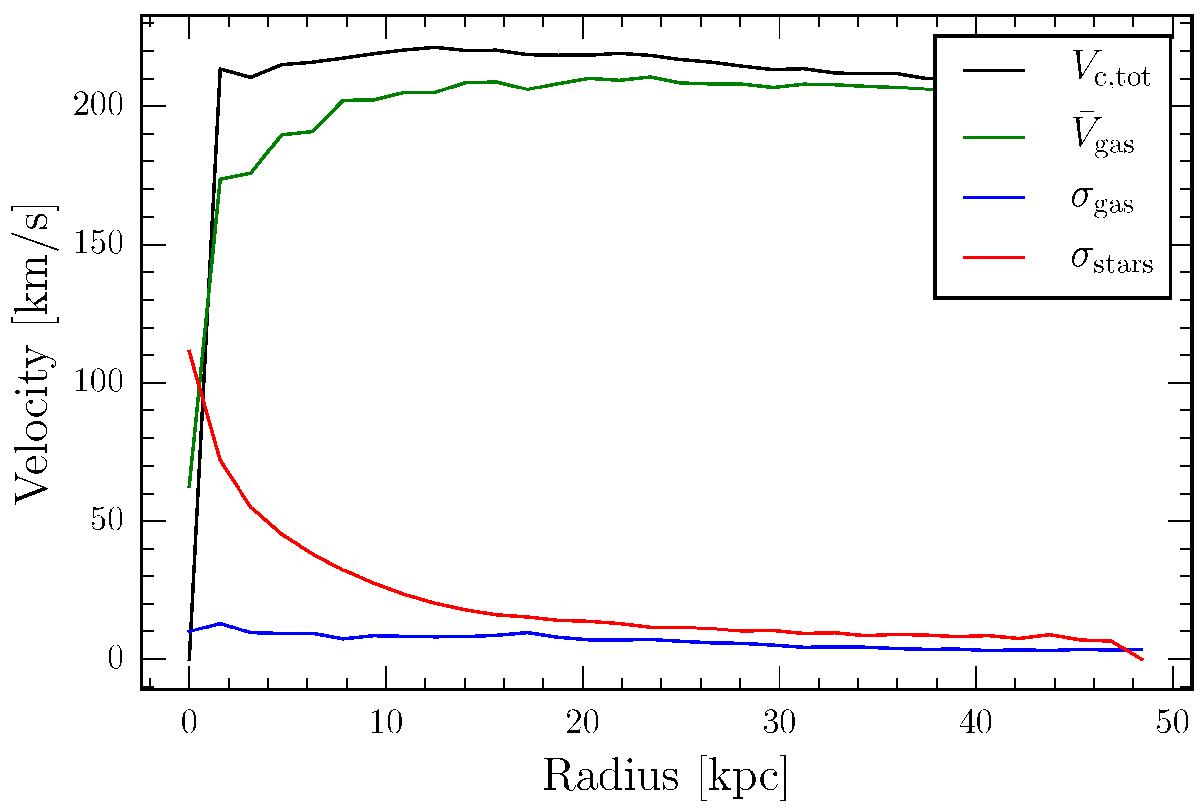
Rotation curve and velocity dispersions of a Milky Way model run with the smooth metallicity scheme. The black line corresponds to the total rotation curve while the green line is the mean azimuthal rotation of the gas. The velocity dispersions of the gas and the stars are given by blue and red curves, respectively.
Current usage metrics show cumulative count of Article Views (full-text article views including HTML views, PDF and ePub downloads, according to the available data) and Abstracts Views on Vision4Press platform.
Data correspond to usage on the plateform after 2015. The current usage metrics is available 48-96 hours after online publication and is updated daily on week days.
Initial download of the metrics may take a while.