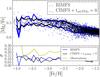
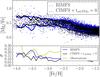
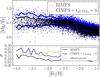
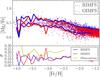
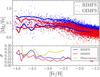
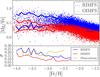
Fig. 11
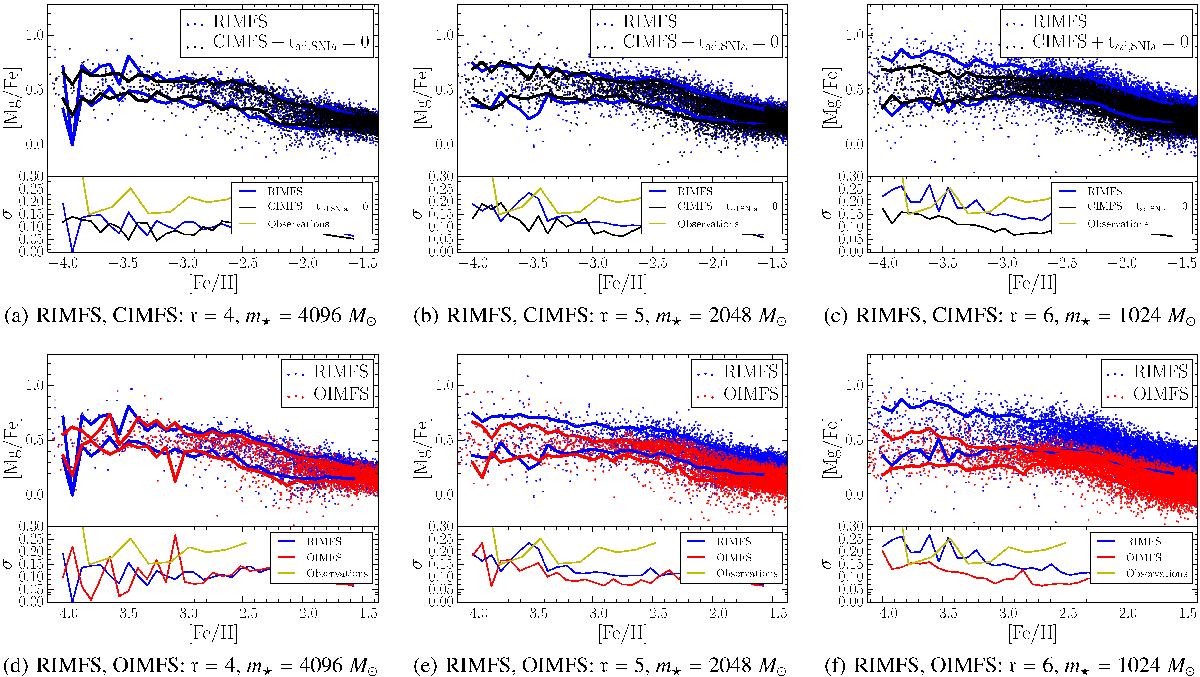
Stars [Mg/Fe] as a function of [Fe/H] for the Fornax model, at t = 14 Gyr. On top, the RIMFS scheme is compared to the CIMFS, while on the bottom it is compared to the OIMFS scheme. From left to right, the panels show the effect of the increase in resolution. The yellow curve shown on the bottom of each plot corresponds to the observed dispersion in [Mg/Fe] extracted from all stars of Fig. 1.
Current usage metrics show cumulative count of Article Views (full-text article views including HTML views, PDF and ePub downloads, according to the available data) and Abstracts Views on Vision4Press platform.
Data correspond to usage on the plateform after 2015. The current usage metrics is available 48-96 hours after online publication and is updated daily on week days.
Initial download of the metrics may take a while.