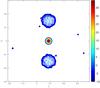
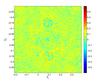
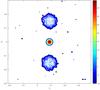
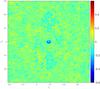
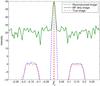
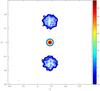
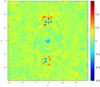
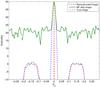
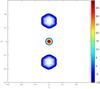
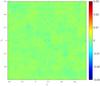
Fig. 3
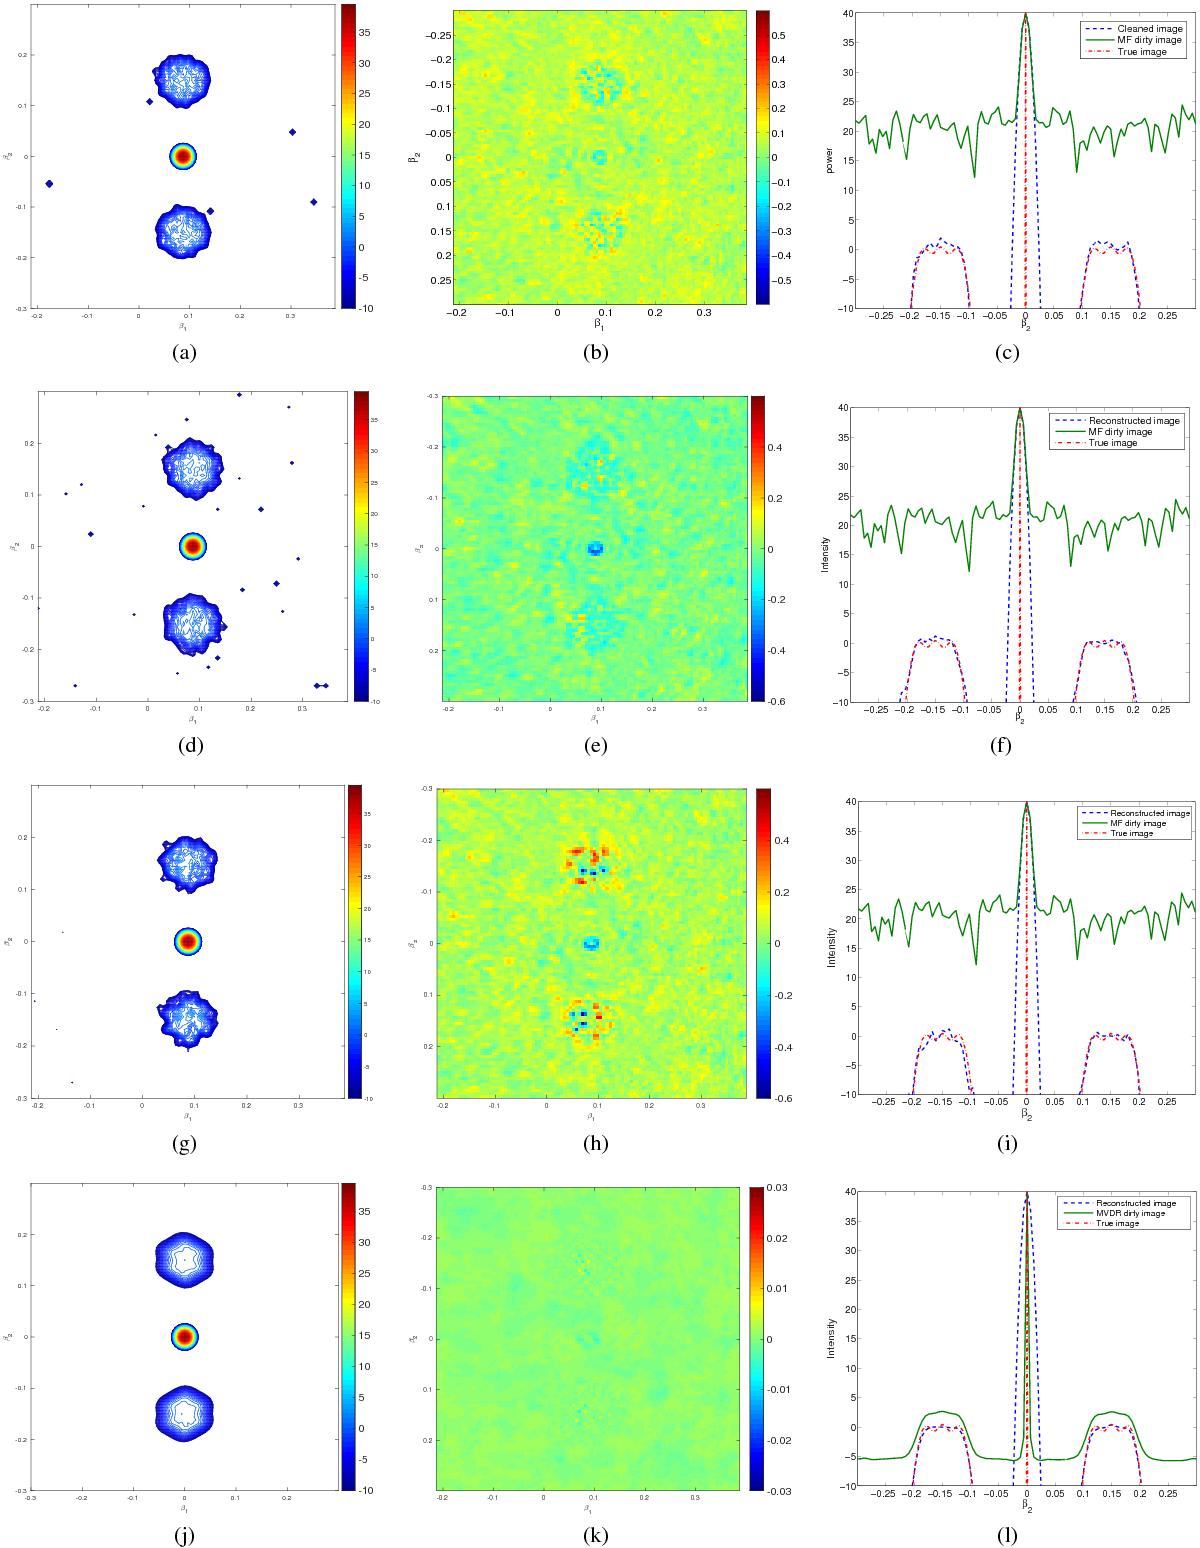
Extended source simulations. Units for the first and third columns are in dB. Linear scale is used for residual images (second column). a) CLEAN Image. b) CLEAN Residual image. c) CLEAN cross-section. d) Solution of CLS + MF. e) Residual image for CLS + MF. f) Cross-section for CLS + MF. g) Solution of CLS + MVDR. h) Residual image for CLS + MVDR. i) Cross-section for CLS image + MVDR. j) CPWLS image. k) CPWLS residual image. l) MVDR dirty image and CPWLS cross-section.
Current usage metrics show cumulative count of Article Views (full-text article views including HTML views, PDF and ePub downloads, according to the available data) and Abstracts Views on Vision4Press platform.
Data correspond to usage on the plateform after 2015. The current usage metrics is available 48-96 hours after online publication and is updated daily on week days.
Initial download of the metrics may take a while.