Fig. 3
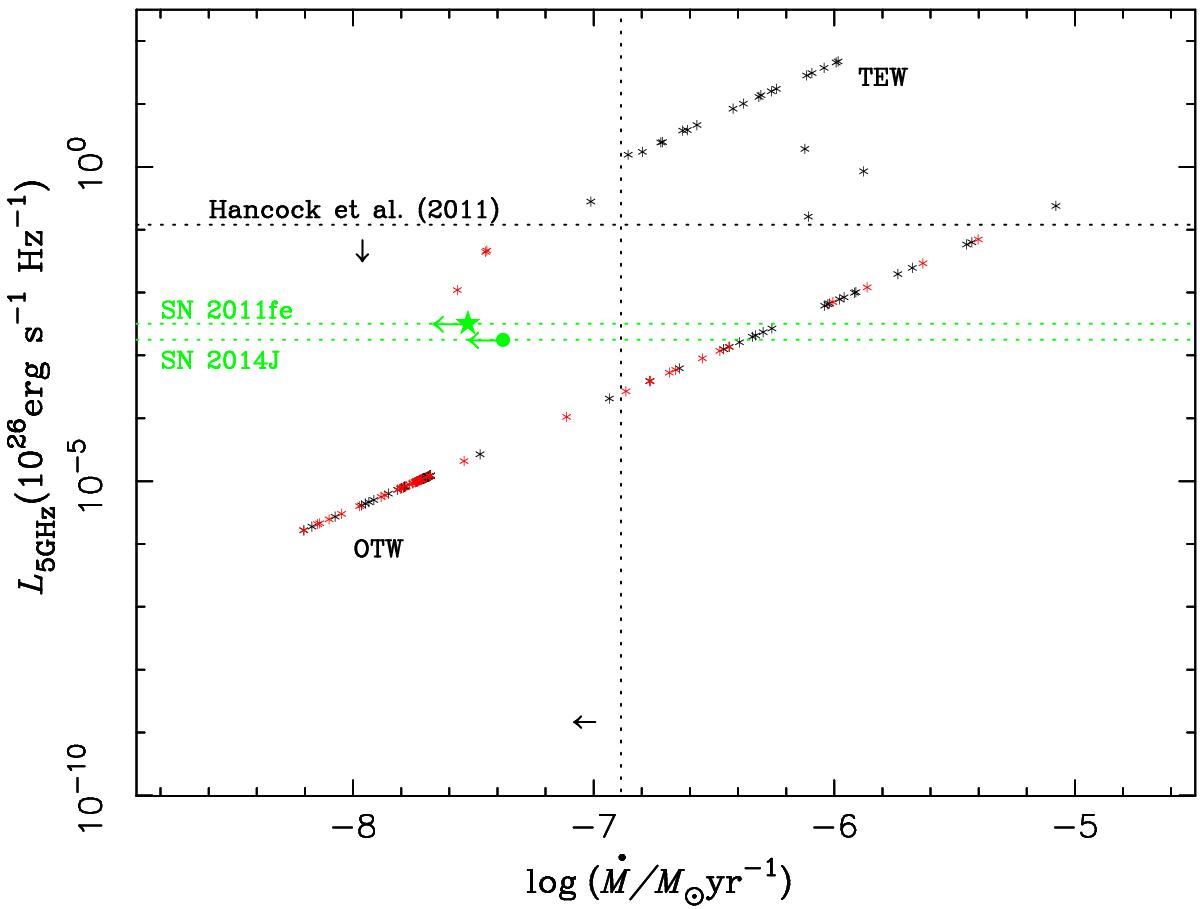
Radio luminosity of 5 GHz from the interaction between supernova ejecta and CSM, as well as the total mass-loss rate from the symbiotic system, 20 days after a supernova explosion. The black dotted lines are the observational constraints from Hancock et al. (2011), while the green dotted lines are for SNe 2011fe and 2014J. The data for 2011fe is the stacked EVLA radio luminosity on an averaged date of 9.1 days after explosion and an average baseband of 5.9 GHz (Chomiuk et al. 2012). The data for 2014J is from the observation of 5.5 GHz, 8.2 days after the explosion, which is the most stringent constraint among the observations in Pérez-Torres et al. (2014). The green-filled star and circle show the upper limit of the progenitor mass-loss rate for SNe 2011fe and 2014J, respectively, assuming a wind velocity of 1000 km s-1. The radio luminosity here is clearly divided into two sequences. The top sequence indicates that the tidally enhanced wind dominates the mass loss, while the bottom one means that mass loss from the surface of WDs is dominant. The red and black points are from the cases of ![]() and
and ![]() , respectively.
, respectively.
Current usage metrics show cumulative count of Article Views (full-text article views including HTML views, PDF and ePub downloads, according to the available data) and Abstracts Views on Vision4Press platform.
Data correspond to usage on the plateform after 2015. The current usage metrics is available 48-96 hours after online publication and is updated daily on week days.
Initial download of the metrics may take a while.