Fig. 2
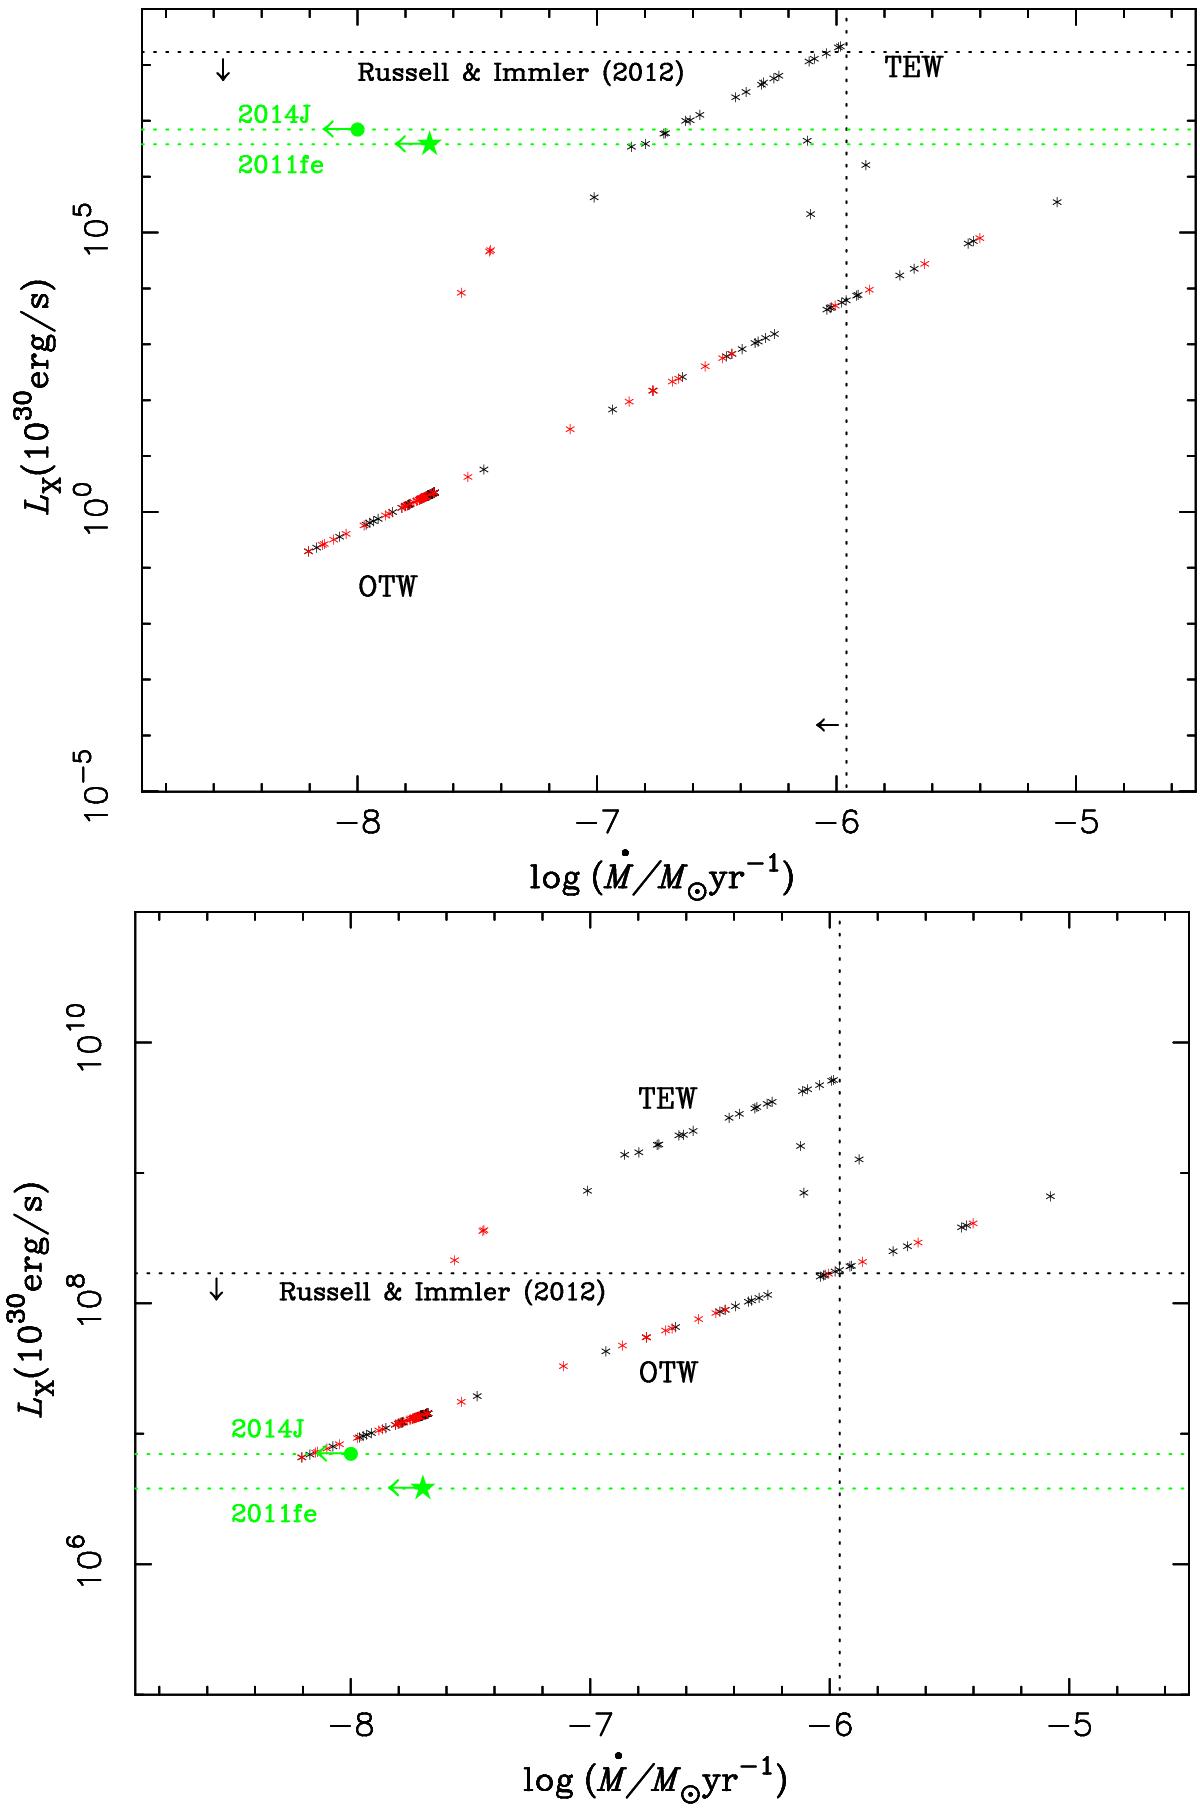
X-ray luminosity on the basis of the different X-ray emission mechanisms from the interaction between supernova ejecta and CSM, as well as the total mass-loss rate from symbiotic systems at 20 days after supernova explosion. The black dotted lines are the observational constraints from Russell & Immler (2012), while the green ones are for SNe 2011fe and 2014J in Margutti et al. (2012; 2014). The green filled star and circle show the upper limit of the progenitor mass-loss rate for SNe 2011fe and 2014J, respectively, assuming a wind velocity of 1000 km s-1 and the inverse Compton mechanism dominating the X-ray flux based on the results in Margutti et al. (2012; 2014). The X-ray luminosity here is clearly divided into two sequences. The top sequence indicates that the tidally enhanced wind (TEW) dominates the mass loss, while the bottom one means that mass loss from the surface of WDs as the optically thick wind (OTW) is dominant. The red and black points are from the cases of ![]() and
and ![]() , respectively. Upper: based on the TB model with an assumption that the luminosity from the reverse shock is 30 times higher than that from the forward shock. Bottom: based on the IC model and extrapolating it to higher mass-loss rates.
, respectively. Upper: based on the TB model with an assumption that the luminosity from the reverse shock is 30 times higher than that from the forward shock. Bottom: based on the IC model and extrapolating it to higher mass-loss rates.
Current usage metrics show cumulative count of Article Views (full-text article views including HTML views, PDF and ePub downloads, according to the available data) and Abstracts Views on Vision4Press platform.
Data correspond to usage on the plateform after 2015. The current usage metrics is available 48-96 hours after online publication and is updated daily on week days.
Initial download of the metrics may take a while.