Fig. B.4
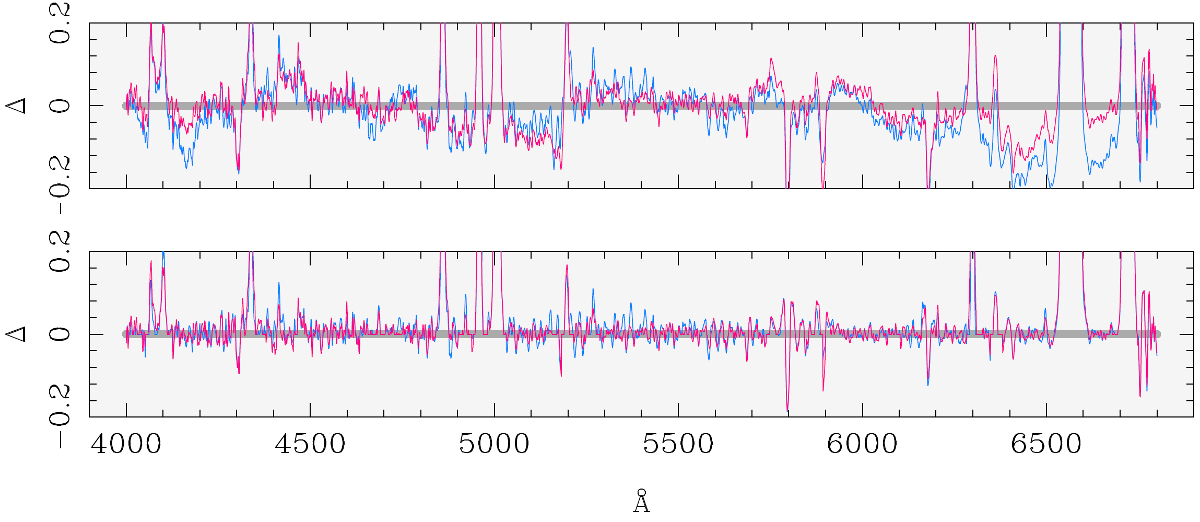
Upper panel: subtraction of the best-fitting stellar SED computed with Starlight with two different SSP libraries (BC03 and MILES; blue and magenta, respectively) from an observed sisp spectrum extracted from an off-nucleus region of a CALIFA ETG. The fit residuals are comparatively small, on the order of 1–2σ of the continuum in the blue spectral range, but they are systematic. lower panel: the same spectrum after rectification of the rest-continuum.
Current usage metrics show cumulative count of Article Views (full-text article views including HTML views, PDF and ePub downloads, according to the available data) and Abstracts Views on Vision4Press platform.
Data correspond to usage on the plateform after 2015. The current usage metrics is available 48-96 hours after online publication and is updated daily on week days.
Initial download of the metrics may take a while.