Fig. B.2
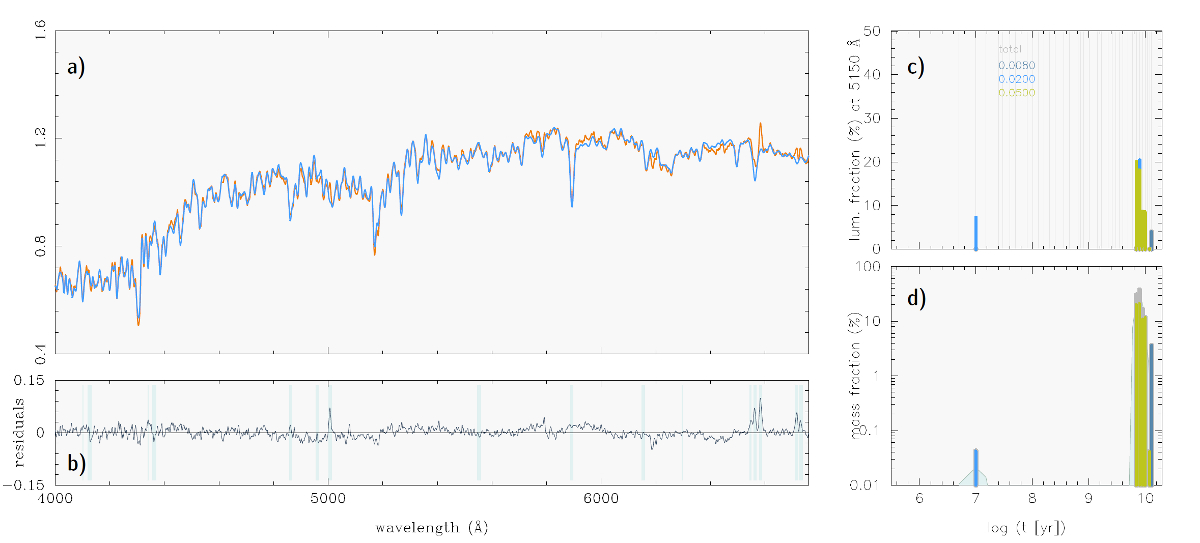
a) Example of a high-quality fit with Starlight to a V500 spectrum (blue and orange, respectively) extracted from an off-nucleus spaxel of the ETG NGC 5966. From the lower left panel b) it is apparent that the fit residuals are small (on average, ≲5% of the stellar continuum level) but systematic (see also Fig. B.4 and discussion in Appendix B.2). Shaded areas depict wavelength intervals that were flagged before spectral fitting. Panels c) and d) display the luminosity (xj) and mass (μj) contribution of individual SSPs (1 ...j) in the best-fitting population vector. The thin gray vertical lines in the upper right panel depict the 34 ages available in the SSP library for three stellar metallicities (color coded), and the shaded area in the lower panel shows a smoothed version of the μj, which is meant as an illustration of the star formation history. The fit implies a dominant old (pAGB) stellar population that has suffered little intrinsic extinction (AV ≲ 0.2 mag).
Current usage metrics show cumulative count of Article Views (full-text article views including HTML views, PDF and ePub downloads, according to the available data) and Abstracts Views on Vision4Press platform.
Data correspond to usage on the plateform after 2015. The current usage metrics is available 48-96 hours after online publication and is updated daily on week days.
Initial download of the metrics may take a while.