Free Access
Fig. C.29
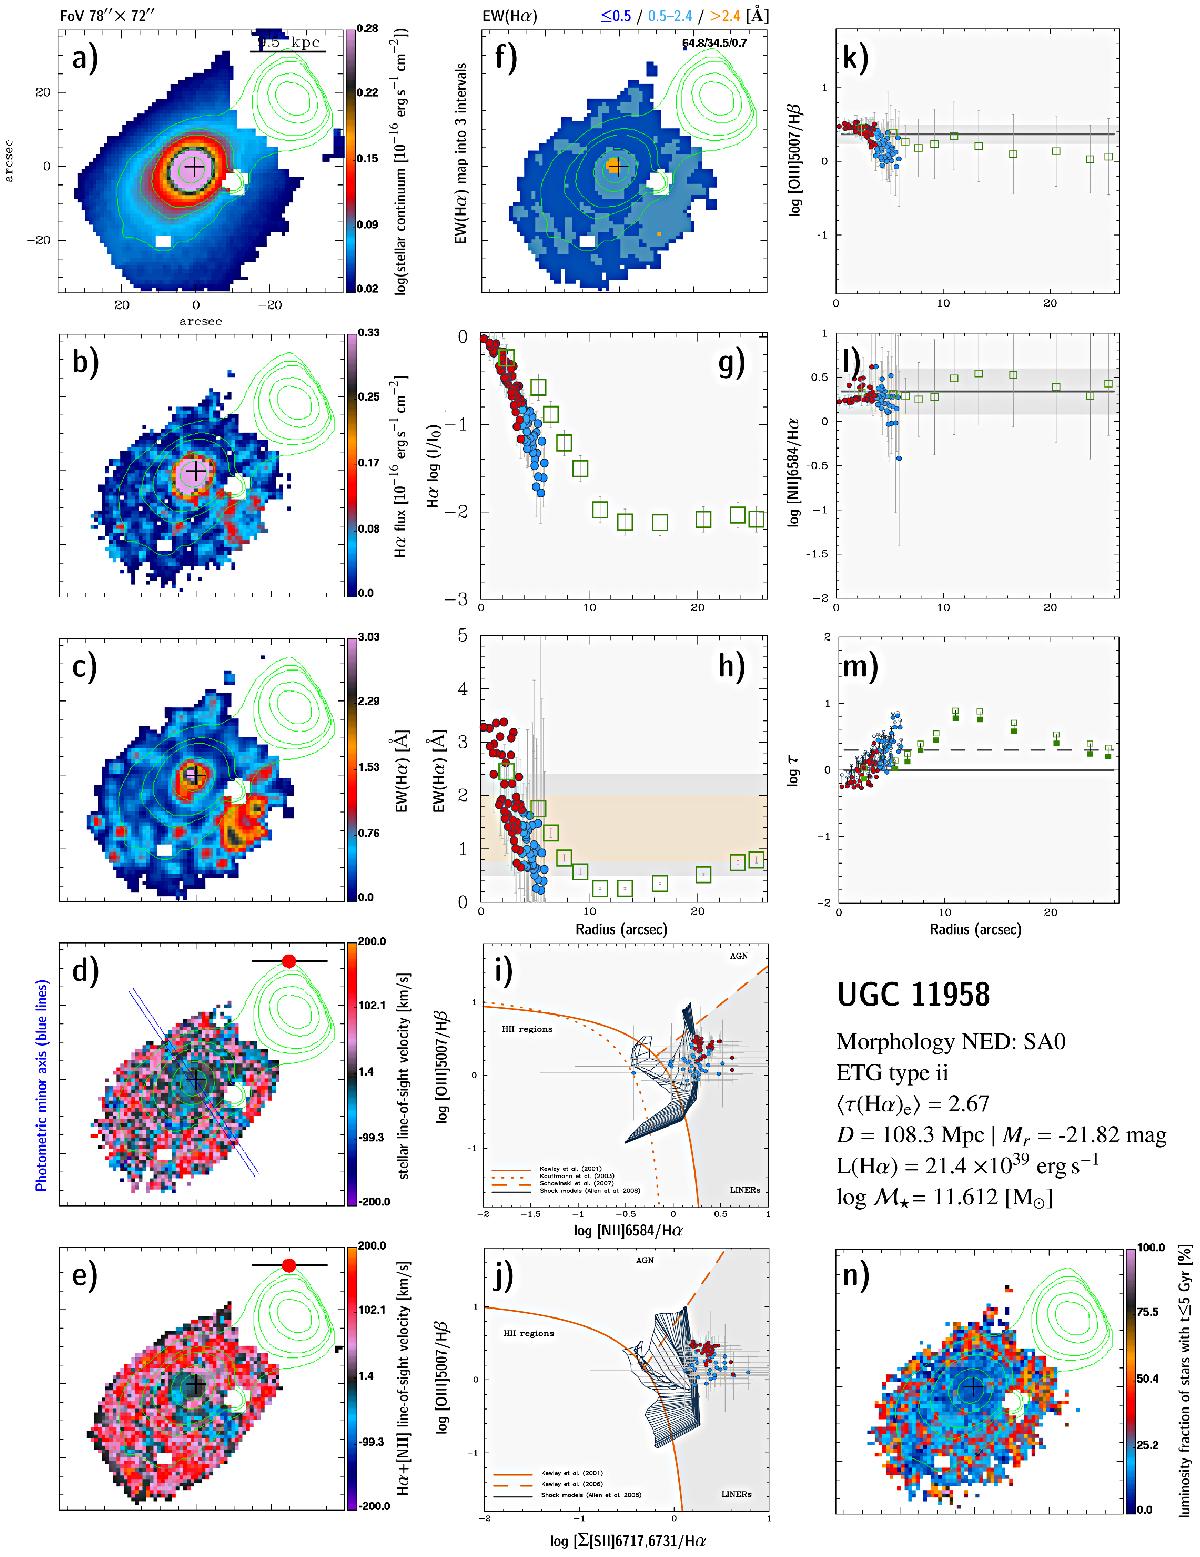
UGC 11958: 2D maps (panels a)–f) and n)), radial intensity and EW of Hα (panels g) and h)), BPT diagrams (panels i) and j)), radial distribution of diagnostic line ratios (k) and l)), and the τ ratio (panel m)). In all 2D maps north is up and east to the left. The bar corresponds to 20′′.
Current usage metrics show cumulative count of Article Views (full-text article views including HTML views, PDF and ePub downloads, according to the available data) and Abstracts Views on Vision4Press platform.
Data correspond to usage on the plateform after 2015. The current usage metrics is available 48-96 hours after online publication and is updated daily on week days.
Initial download of the metrics may take a while.