Fig. 2
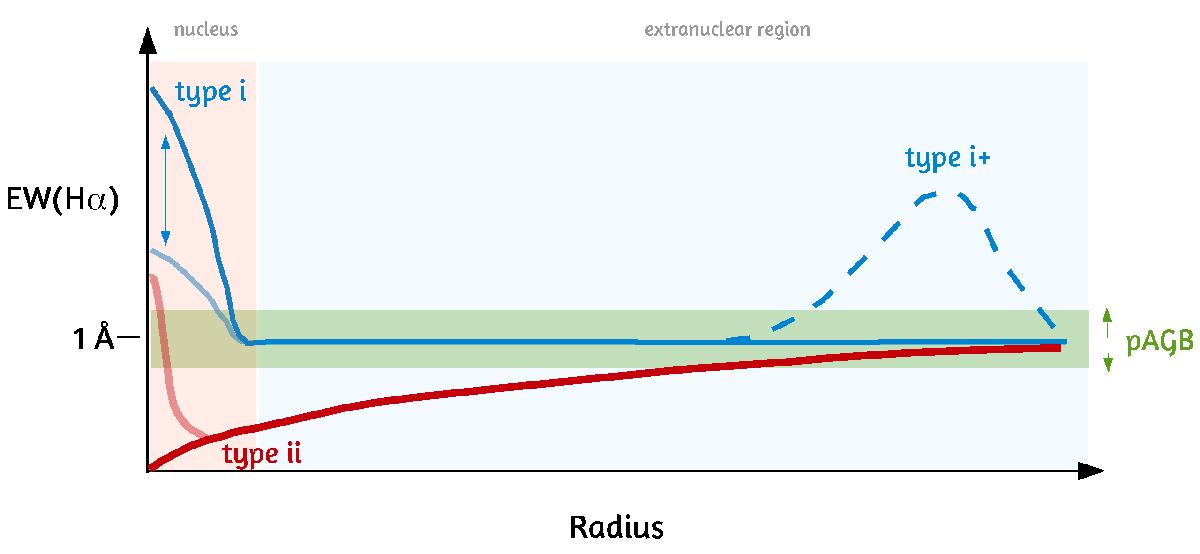
Schematic representation of the two main classes of ETGs, as defined in P13. The EW(Hα) profiles of type i ETGs (blue), such as NGC 1167, show in their extranuclear component (beyond the radius range depicted by the vertical shaded area; typically ~2 kpc in our sample) nearly constant values within the narrow range between EW![]() and EW
and EW![]() (green horizontal strip), with a mean value of typically ~1 Å. A few of these systems (labeled i+, blue dashed curve; e.g., NGC 1349) additionally show a steep EW(Hα) increase above EW
(green horizontal strip), with a mean value of typically ~1 Å. A few of these systems (labeled i+, blue dashed curve; e.g., NGC 1349) additionally show a steep EW(Hα) increase above EW![]() in their periphery (>1 effective radius), which, as we discuss in Gomes et al. (2015), Gomes et al. (2016; see also Sect. 5.2), is owing to low-level star-forming activity. By contrast, type ii ETGs (red curve) show a centrally very low (≤0.5 Å) mean EW(Hα), increasing smoothly to
in their periphery (>1 effective radius), which, as we discuss in Gomes et al. (2015), Gomes et al. (2016; see also Sect. 5.2), is owing to low-level star-forming activity. By contrast, type ii ETGs (red curve) show a centrally very low (≤0.5 Å) mean EW(Hα), increasing smoothly to ![]() at their periphery (e.g., NGC 6411). Regarding their nuclear properties, both ETG types display a considerable diversity, from systems with virtually wim-evacuated cores (<0.5 Å) to galaxies hosting a compact central core with an EW(Hα) of a few EW
at their periphery (e.g., NGC 6411). Regarding their nuclear properties, both ETG types display a considerable diversity, from systems with virtually wim-evacuated cores (<0.5 Å) to galaxies hosting a compact central core with an EW(Hα) of a few EW![]() . The profiles in light blue and light red are added to illustrate the spread in the nuclear EW(Hα)s of our sample ETGs.
. The profiles in light blue and light red are added to illustrate the spread in the nuclear EW(Hα)s of our sample ETGs.
Current usage metrics show cumulative count of Article Views (full-text article views including HTML views, PDF and ePub downloads, according to the available data) and Abstracts Views on Vision4Press platform.
Data correspond to usage on the plateform after 2015. The current usage metrics is available 48-96 hours after online publication and is updated daily on week days.
Initial download of the metrics may take a while.