Fig. B.6
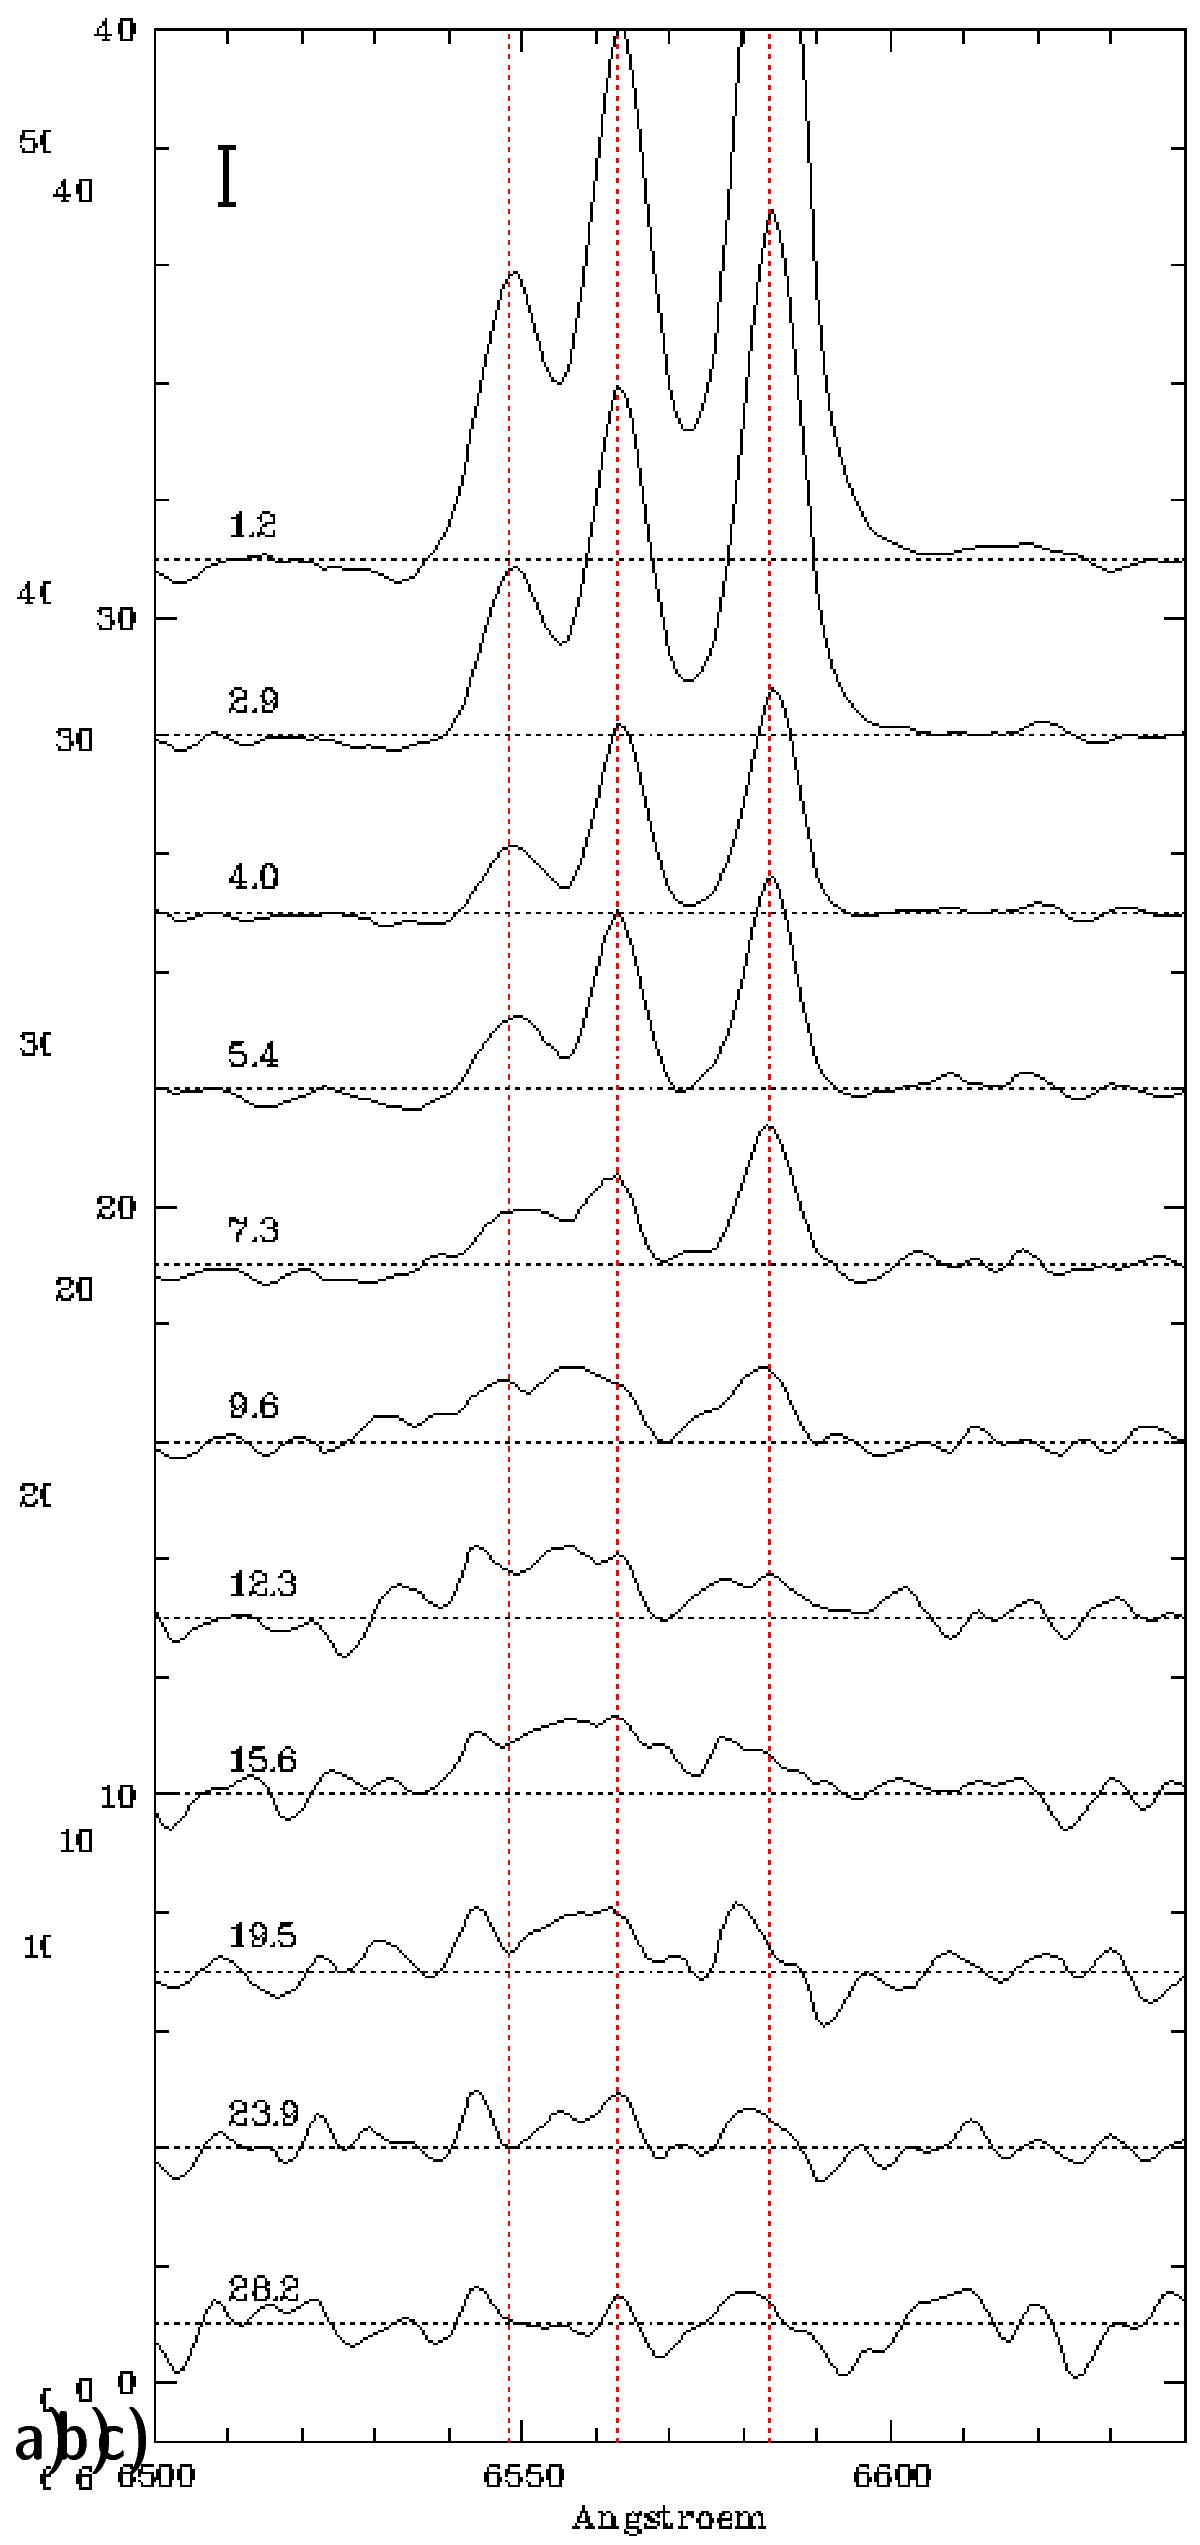
Integrated spectra of the type i ETG NGC 1167a) and the type ii ETGs NGC 6338 and NGC 7550 (panels b) and c), respectively) within successive isophotal annuli (isan), after subtracting the stellar emission and rectifying the continuum. Each spectrum is labeled with the photometric radius (′′) of the annulus within which it was sampled and is vertically shifted by an arbitrary amount, with the overlaid dotted horizontal lines depicting the zero level. The vertical bar in each panel corresponds to a flux level interval of 10-16 erg s-1 cm-2. The extreme faintness of extended nebular emission in type ii ETGs, as compared to the type i ETG NGC 1167, is apparent.
Current usage metrics show cumulative count of Article Views (full-text article views including HTML views, PDF and ePub downloads, according to the available data) and Abstracts Views on Vision4Press platform.
Data correspond to usage on the plateform after 2015. The current usage metrics is available 48-96 hours after online publication and is updated daily on week days.
Initial download of the metrics may take a while.