Fig. 2
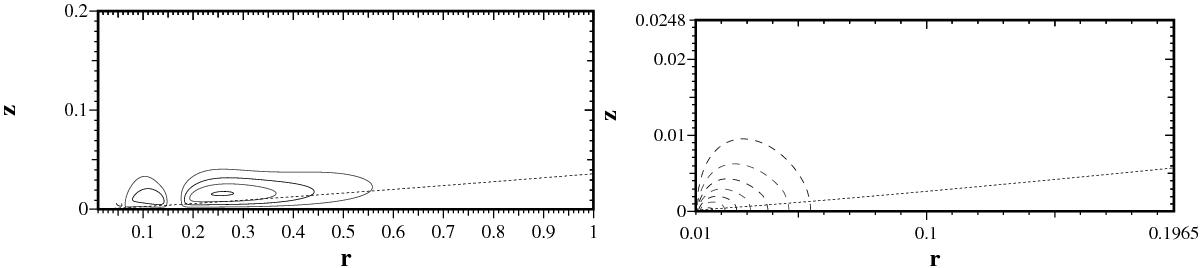
Global solution (left, contours of the poloidal field) and a magnified view of the solution near r = rin (right, contours of toroidal field), for the somewhat supercritical parameters in the 2D model (fv = 0.3). Even parity, P = + 1. In this and subsequent figures, contours are equally spaced, solid contours correspond to positive values, broken contours represent negative values, and the dashed curve shows the disc boundary. In the right hand panel the maximum toroidal field strength occurs at r ≈ 0.015,z = 0 and is approximately 4 × 10⁵ G. The contour interval is approximately 8 × 10⁴ G. In all the models the poloidal field is weaker: here the mean global ratio of poloidal to toroidal field strengths is about 10-2. In this and subsequent figures, the field strength beyond the outermost contour is smaller than that at the outermost contour.
Current usage metrics show cumulative count of Article Views (full-text article views including HTML views, PDF and ePub downloads, according to the available data) and Abstracts Views on Vision4Press platform.
Data correspond to usage on the plateform after 2015. The current usage metrics is available 48-96 hours after online publication and is updated daily on week days.
Initial download of the metrics may take a while.