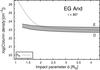
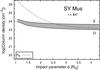
Fig. A.1
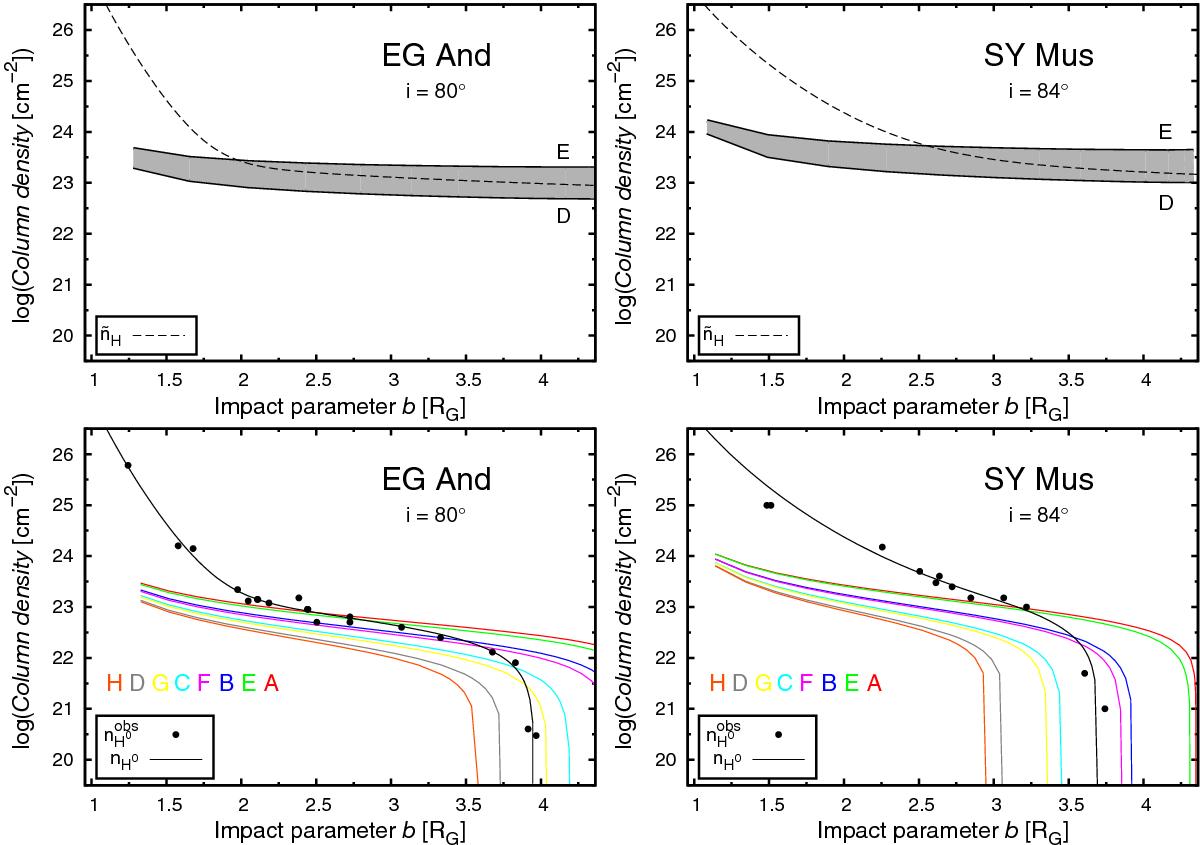
Comparison of hydrogen column densities of this paper with those calculated according to the WCZ models of Paper I. Top panels show examples of models J and M (Eq. (7); dashed lines) with those calculated according to Eq. (A.4) for WCZ models A–H of Paper I (grey area bounded by models E and D). Bottom panels compare the same models, but calculated throughout the neutral zone only (this paper: Eq. (13), solid black line; WCZ models of Paper I: Eq. (A.5), coloured lines).
Current usage metrics show cumulative count of Article Views (full-text article views including HTML views, PDF and ePub downloads, according to the available data) and Abstracts Views on Vision4Press platform.
Data correspond to usage on the plateform after 2015. The current usage metrics is available 48-96 hours after online publication and is updated daily on week days.
Initial download of the metrics may take a while.