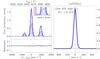
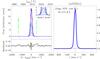
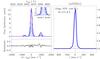
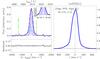
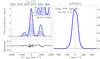
Fig. 6
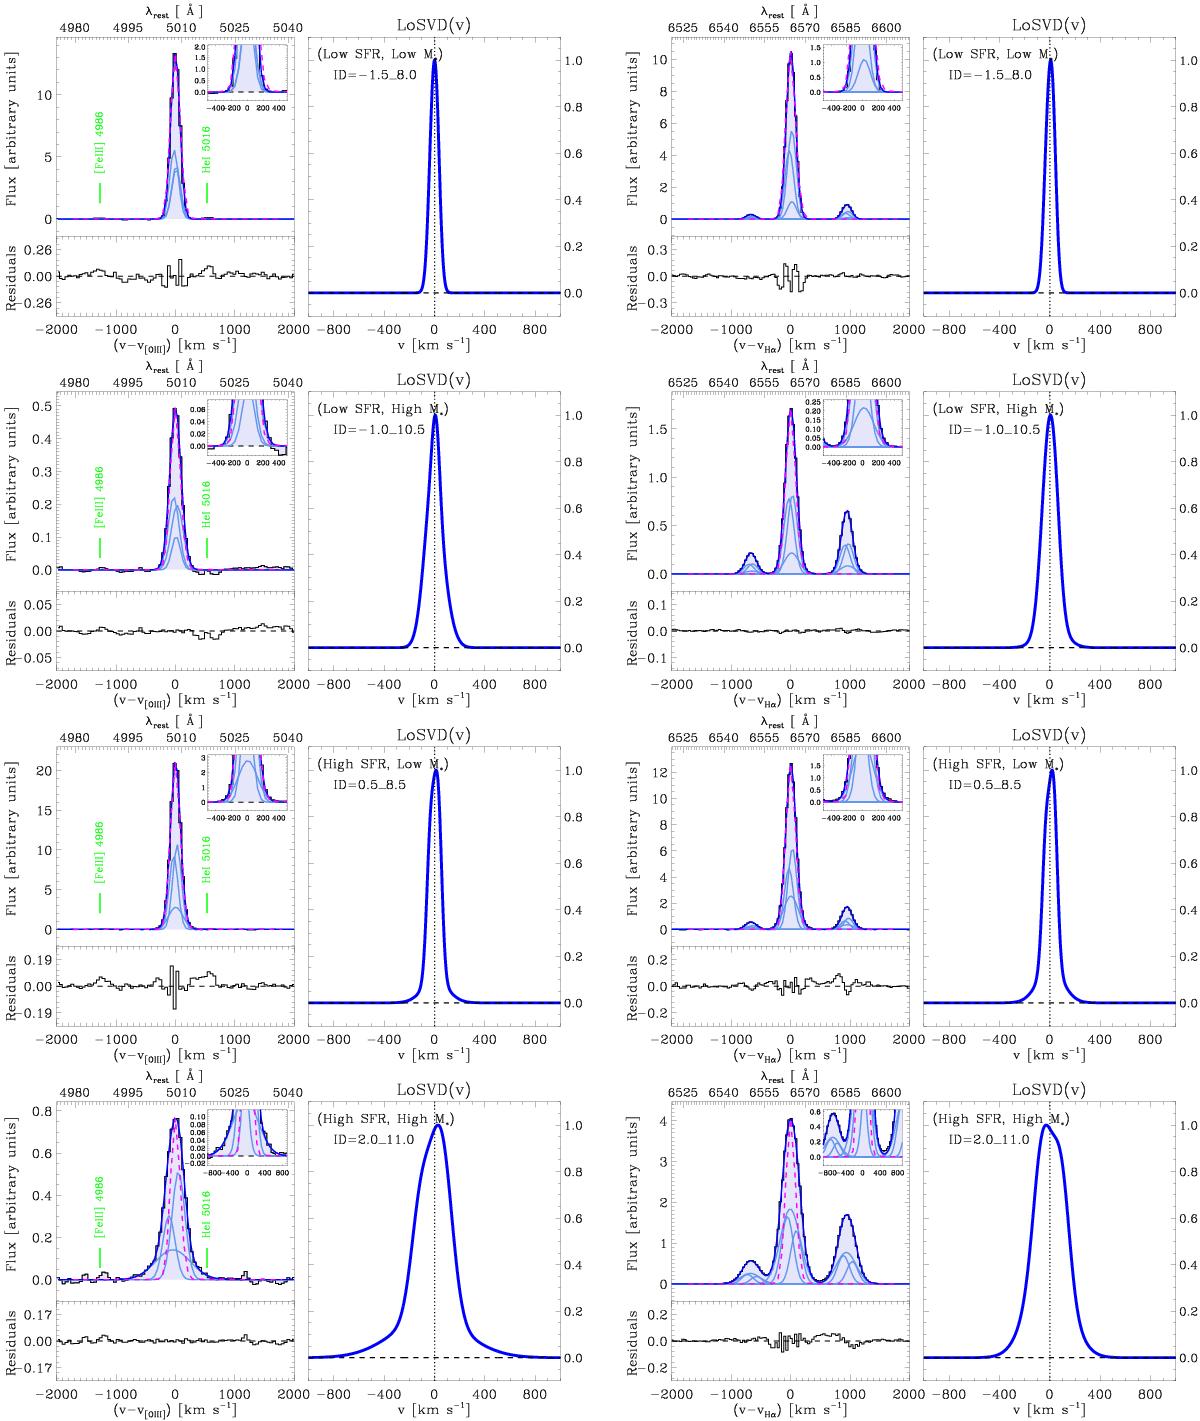
Examples of spectral fits to the [OIII]λ5007 (left column) and Hα+[NII] (right column) emission line profiles for four representative galaxy bins with different SFR and M∗. From top to bottom: ID = −1.5_8.0 (low SFR and low M∗), ID = −1.0_10.5 (low SFR and high M∗), ID = 0.5_8.5 (high SFR and low M∗), and ID = 2.0_11.0 (high SFR and high M∗). In each plot, the left panel shows the fit to the data (solid curves, the total fit is in blue, the multiple Gaussian components in a lighter shade of blue). For comparison, we have overplotted to the data the average SDSS instrumental resolution profile (magenta dashed curve, from Fig. 4). In the right panel of each plot we show the final LoSVD of the ionised gas resulting from the fit, hence deconvolved from the SDSS instrumental profile (details in Sect. 2.6).
Current usage metrics show cumulative count of Article Views (full-text article views including HTML views, PDF and ePub downloads, according to the available data) and Abstracts Views on Vision4Press platform.
Data correspond to usage on the plateform after 2015. The current usage metrics is available 48-96 hours after online publication and is updated daily on week days.
Initial download of the metrics may take a while.