Fig. 5
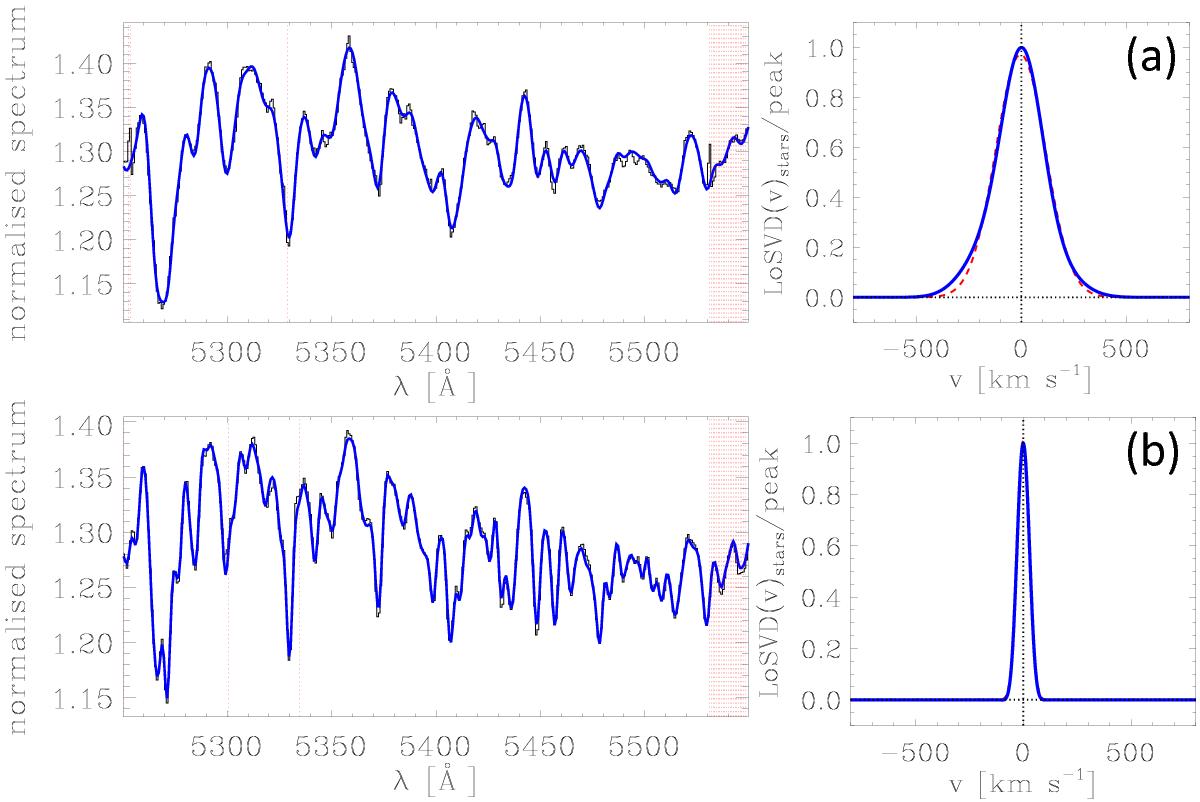
Stellar continuum fit over the range λ ∈ [5250,5550] Å (left) and resulting stellar LoSVD (right) derived for two galaxy stacks, i.e. ID = −0.5_11.0 (panel a)) and ID = −1.5_9.5 (panel b)). In the left panels, the stacked spectrum is plotted in black, and the best fit to the stellar continuum is in blue. The red dashed regions indicate the spectral windows masked from the stellar continuum fit because of the presence of nebular features. In the right panels, the red dashed line indicates the LoSVD profile obtained by using, in the pPXF procedure, a simple Gaussian function to model the stellar features, while the blue solid line shows the stellar LoSVD profile obtained by allowing the use of Hermite polynomials to account for possible asymmetries of the stellar absorption features (Cappellari & Emsellem 2004). The stellar LoSVD obtained for the stack ID = −0.5_11.0 shows a clear blue asymmetry. The fit is excellent (![]() = 0.8) for both stacks.
= 0.8) for both stacks.
Current usage metrics show cumulative count of Article Views (full-text article views including HTML views, PDF and ePub downloads, according to the available data) and Abstracts Views on Vision4Press platform.
Data correspond to usage on the plateform after 2015. The current usage metrics is available 48-96 hours after online publication and is updated daily on week days.
Initial download of the metrics may take a while.