Fig. 4
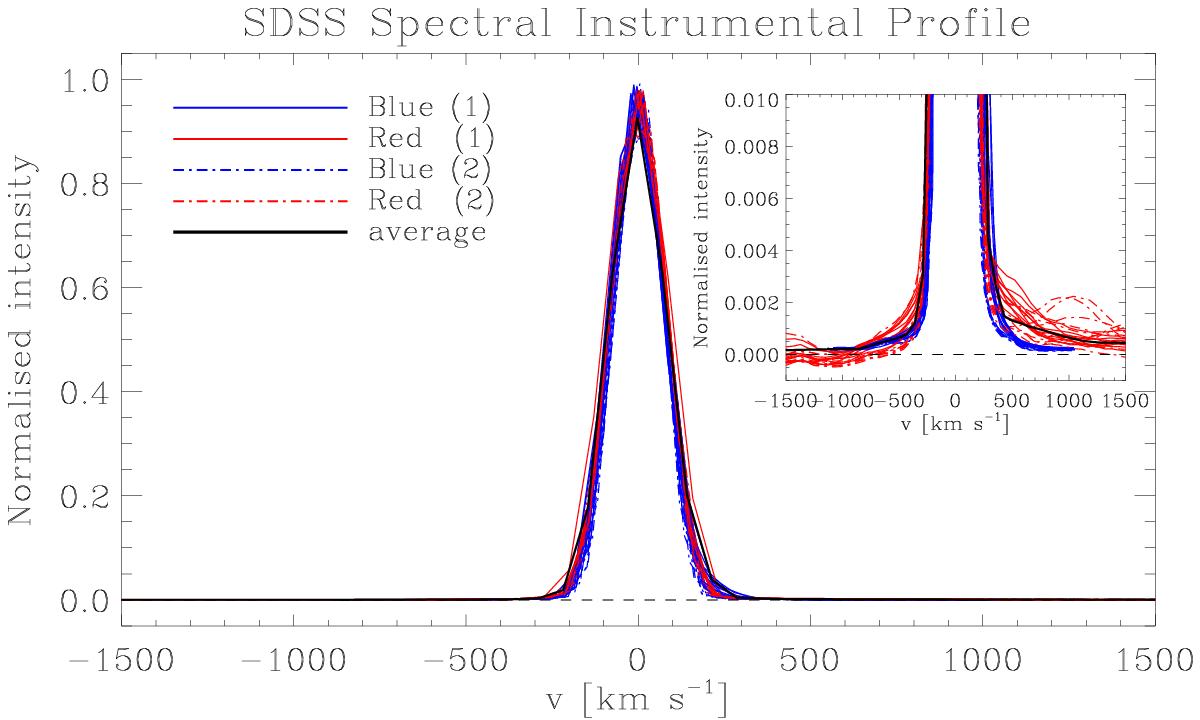
Instrumental profile of the SDSS spectrographs, estimated from bright, unblended emission lines in the arc lamp images, selected within the wavelength range of interest for this study: HgI λ5460.753 Å for the blue cameras and NeI λ6598.953 Å for the red cameras. For each camera (blue/red) of the two spectrographs (1/2), we overplotted ten representative profiles from as many different frames (corresponding to different plates) obtained by averaging the arc lamp spectra over all 320 fibres. The black solid line corresponds to the mean profile. The inset highlights the presence of low-level instrumental wings (corresponding to ≲3/1000 of the peak), which are more prominent for the red cameras.
Current usage metrics show cumulative count of Article Views (full-text article views including HTML views, PDF and ePub downloads, according to the available data) and Abstracts Views on Vision4Press platform.
Data correspond to usage on the plateform after 2015. The current usage metrics is available 48-96 hours after online publication and is updated daily on week days.
Initial download of the metrics may take a while.