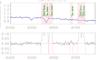
Fig. 3
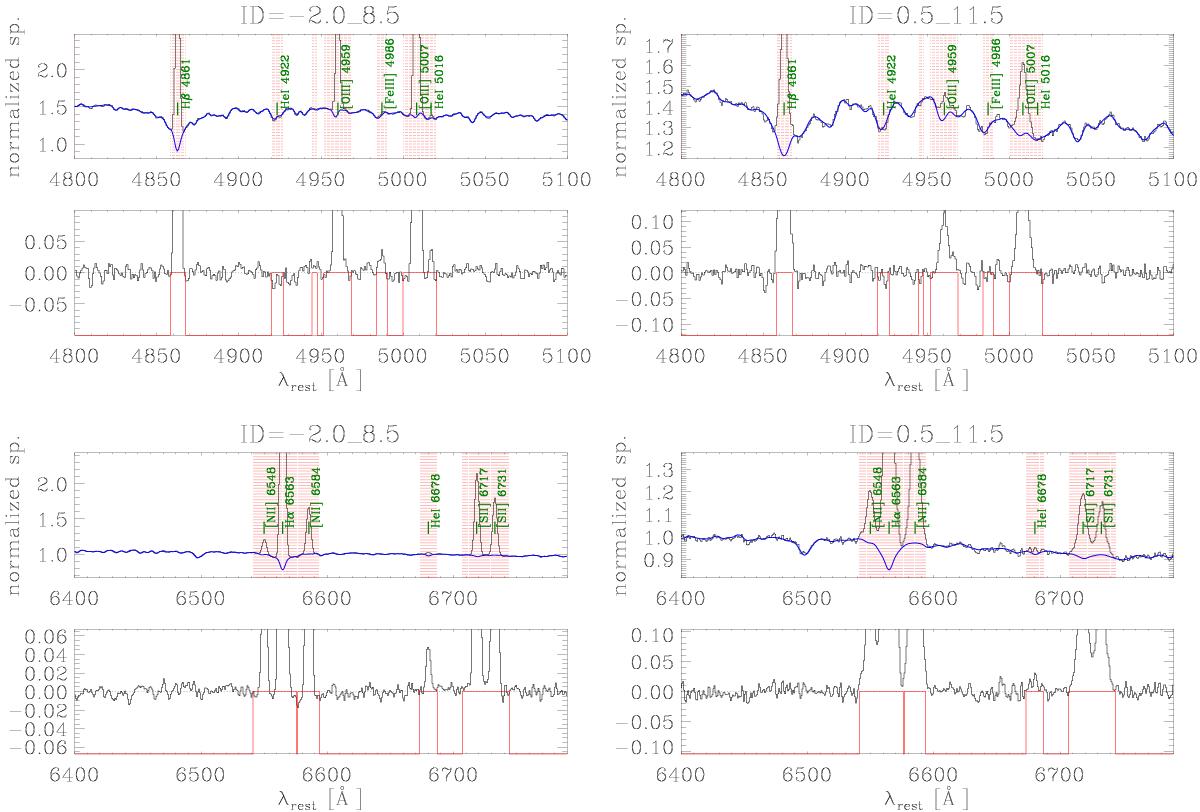
Stellar continuum fit and subtraction over two wavelength ranges including the [OIII]λ5007 emission line (top panels) and the Hα+[NII] emission lines (bottom panels), performed for two galaxy stacks: ID = −2.0_8.5 (left) and ID=0.5_11.5 (right). In each plot, the upper panel shows the stacked spectrum (black) and the best fit to the stellar continuum (blue), while the lower panel shows the residual spectrum. The red-shaded regions mark the spectral windows that contain nebular features and are therefore masked from the stellar continuum fit.
Current usage metrics show cumulative count of Article Views (full-text article views including HTML views, PDF and ePub downloads, according to the available data) and Abstracts Views on Vision4Press platform.
Data correspond to usage on the plateform after 2015. The current usage metrics is available 48-96 hours after online publication and is updated daily on week days.
Initial download of the metrics may take a while.