Fig. A.5
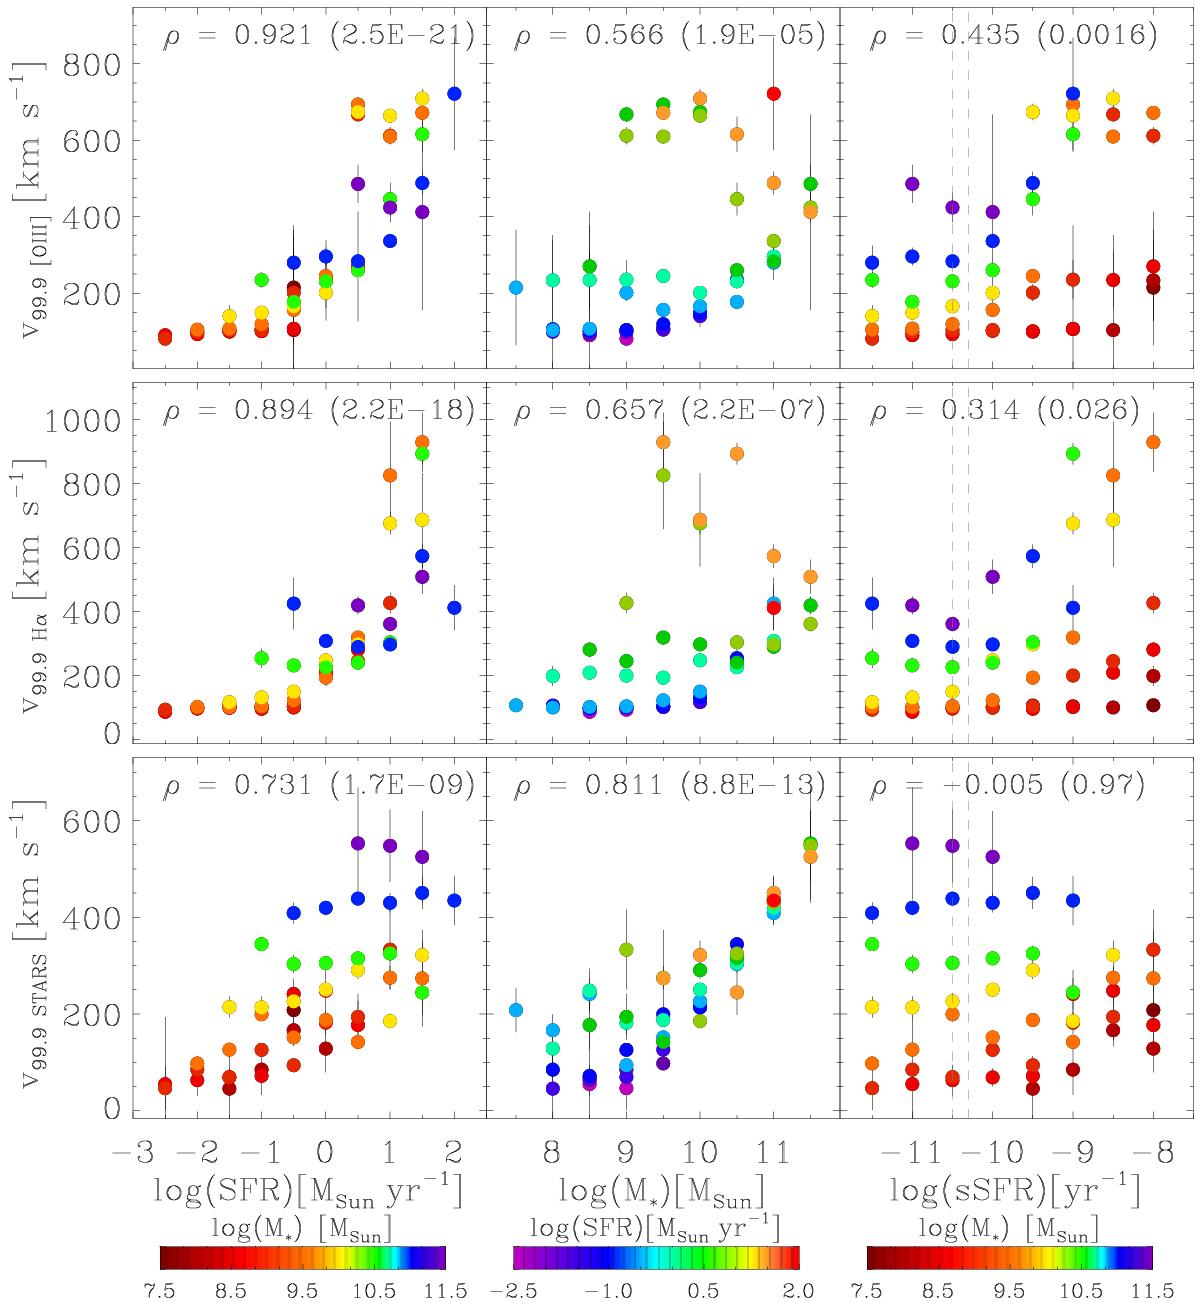
99.9th percentile velocity of the LoSVD of the ionised gas as traced by the [OIII] (top panel) and Hα (middle panel) emission lines, and of the stars (bottom panel). For a Gaussian velocity distribution, the 99.9th percentile velocity corresponds to +3 standard deviations (3σ) from the mean velocity. Similarly to Fig. 14, we report the Spearman rank correlation coefficient ρ for each plot, along with its associated two-sided p value.
Current usage metrics show cumulative count of Article Views (full-text article views including HTML views, PDF and ePub downloads, according to the available data) and Abstracts Views on Vision4Press platform.
Data correspond to usage on the plateform after 2015. The current usage metrics is available 48-96 hours after online publication and is updated daily on week days.
Initial download of the metrics may take a while.