Fig. 19
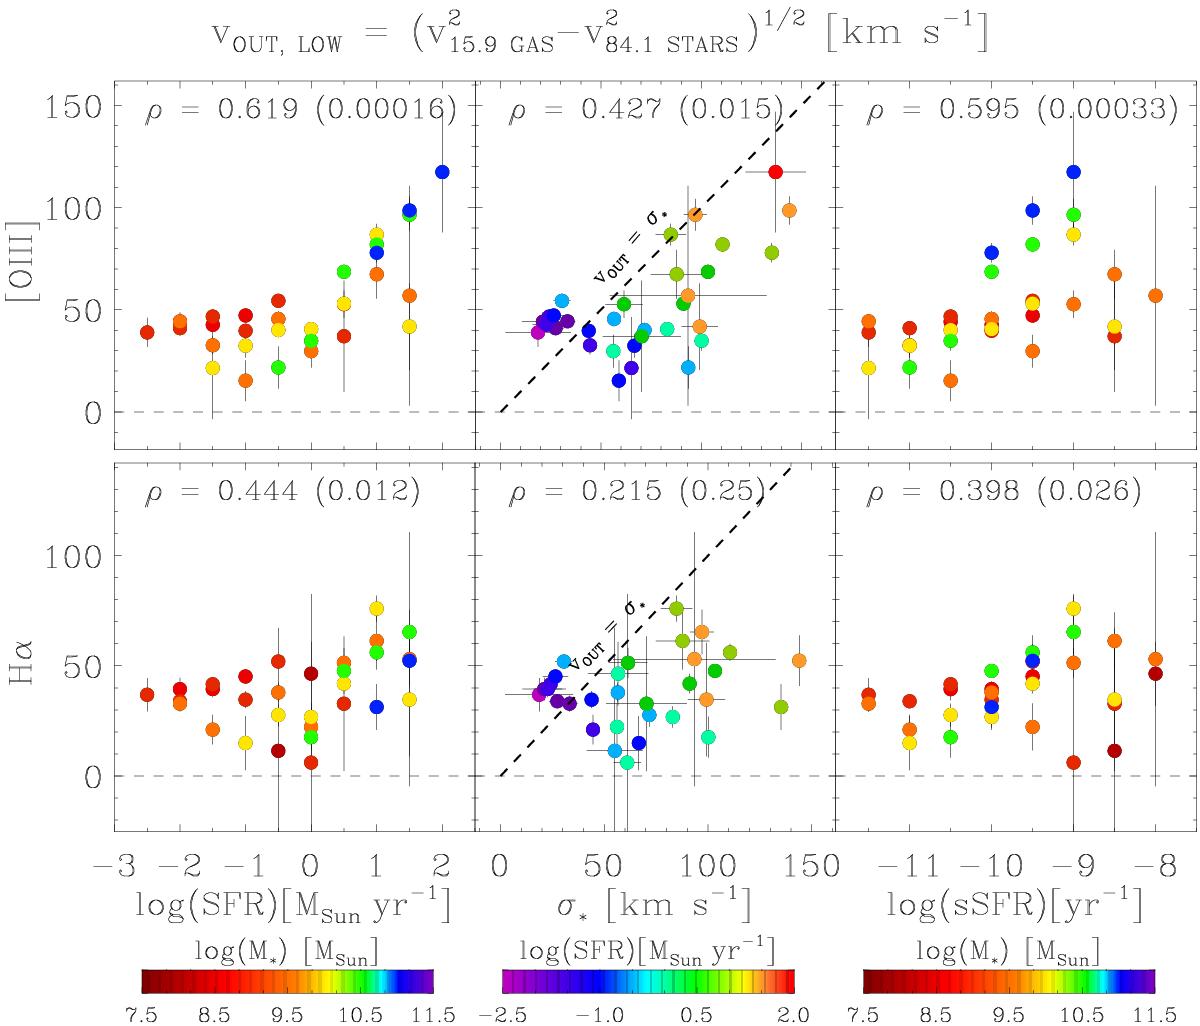
Outflow velocity as given by ![]() (see explanation in Sect. 4.1) inferred from [OIII] (upper panel) and Hα emission (bottom panel), plotted as a function of SFR, stellar velocity dispersion (as obtained from the fit to the stellar continuum), and sSFR. The same bins as Fig. 17 are plotted, excluding those for which
(see explanation in Sect. 4.1) inferred from [OIII] (upper panel) and Hα emission (bottom panel), plotted as a function of SFR, stellar velocity dispersion (as obtained from the fit to the stellar continuum), and sSFR. The same bins as Fig. 17 are plotted, excluding those for which ![]() . In the middle panels, the dashed lines indicate the locus of points where vout = σstars. The Spearman rank correlation coefficient (0 <ρ< 1, higher values of ρ indicate stronger correlation) is reported for each plot, along with the corresponding two-sided p value (if the p value is ≤ α, where α = 0.05 is the level of significance, the observed correlation is statistically significant).
. In the middle panels, the dashed lines indicate the locus of points where vout = σstars. The Spearman rank correlation coefficient (0 <ρ< 1, higher values of ρ indicate stronger correlation) is reported for each plot, along with the corresponding two-sided p value (if the p value is ≤ α, where α = 0.05 is the level of significance, the observed correlation is statistically significant).
Current usage metrics show cumulative count of Article Views (full-text article views including HTML views, PDF and ePub downloads, according to the available data) and Abstracts Views on Vision4Press platform.
Data correspond to usage on the plateform after 2015. The current usage metrics is available 48-96 hours after online publication and is updated daily on week days.
Initial download of the metrics may take a while.