Fig. 17
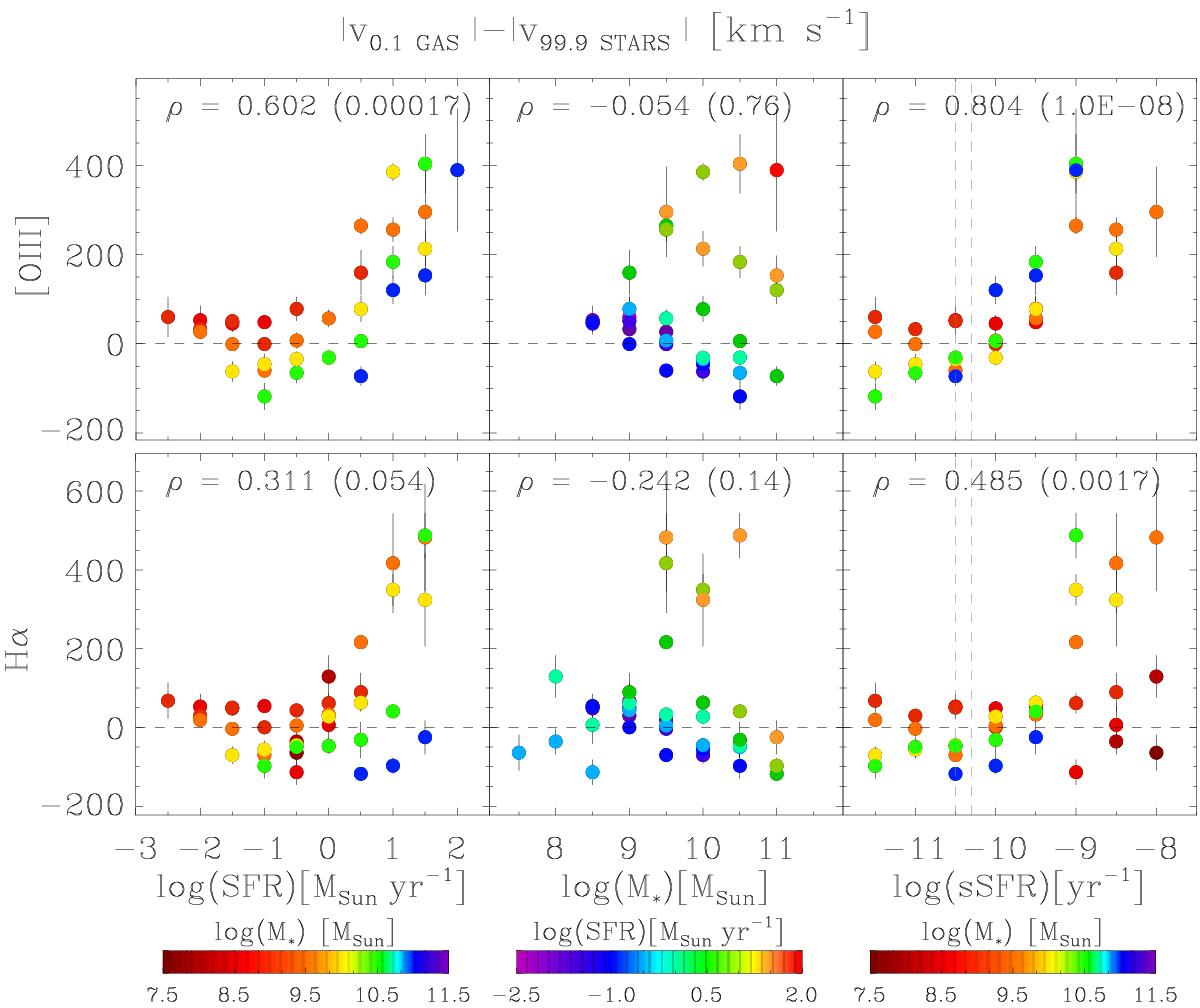
Excess of line-of-sight velocity of the ionised gas with respect to the stars (vgas−vstars) as given by y = | v0.1 gas | − | v99.9 stars | for [OIII] (upper panel) and for Hα (bottom panel). For display purposes, only the less noisy bins are plotted, i.e. only bins with either σy< 50 km s-1 or | y | ≥ 2σy. As explained in Sect. 3.4, the quantity y is a reliable tracer of ionised outflows only when it is positive. The Spearman rank correlation coefficient (0 < | ρ | < 1, higher values of | ρ | indicate stronger correlation, ρ< 0 if there is an anti-correlation) is reported in each plot, along with the corresponding two-sided p value (if the p value is ≤ α, where α = 0.05 is the level of significance, the observed correlation is statistically significant).
Current usage metrics show cumulative count of Article Views (full-text article views including HTML views, PDF and ePub downloads, according to the available data) and Abstracts Views on Vision4Press platform.
Data correspond to usage on the plateform after 2015. The current usage metrics is available 48-96 hours after online publication and is updated daily on week days.
Initial download of the metrics may take a while.