Fig. 16
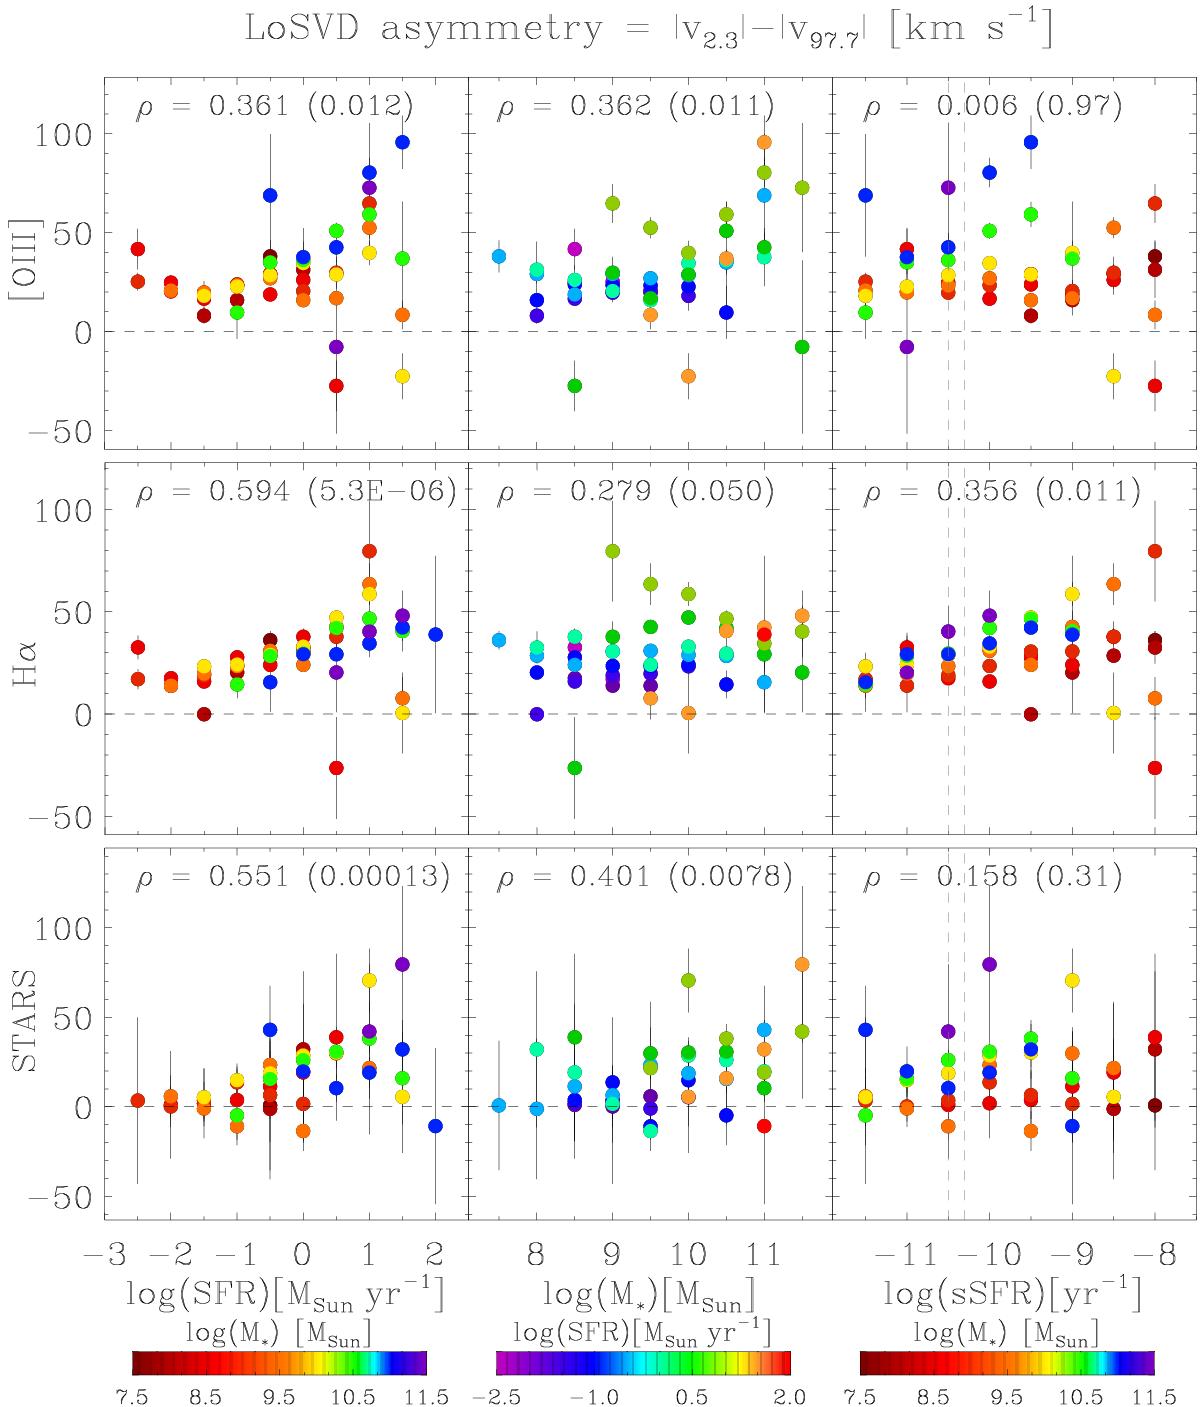
Blue asymmetry of the [OIII] (top panel), Hα (middle panel), and stellar (bottom panel) LoSVDs, as measured by the difference between the (moduli of the) 2.3th and 97.7th percentile velocities (i.e. y = | v2.3 | − | v97.7 |). For display purposes, only the less noisy bins are plotted, i.e. bins with either σy< 50 km s-1 or | y | ≥ 2σy. The Spearman rank correlation coefficient (0 <ρ< 1, higher values of ρ indicate stronger correlation) is reported for each plot, along with the corresponding two-sided p value (if the p-value is ≤α, where α = 0.05 is the level of significance, the observed correlation is statistically significant).
Current usage metrics show cumulative count of Article Views (full-text article views including HTML views, PDF and ePub downloads, according to the available data) and Abstracts Views on Vision4Press platform.
Data correspond to usage on the plateform after 2015. The current usage metrics is available 48-96 hours after online publication and is updated daily on week days.
Initial download of the metrics may take a while.