Fig. 14
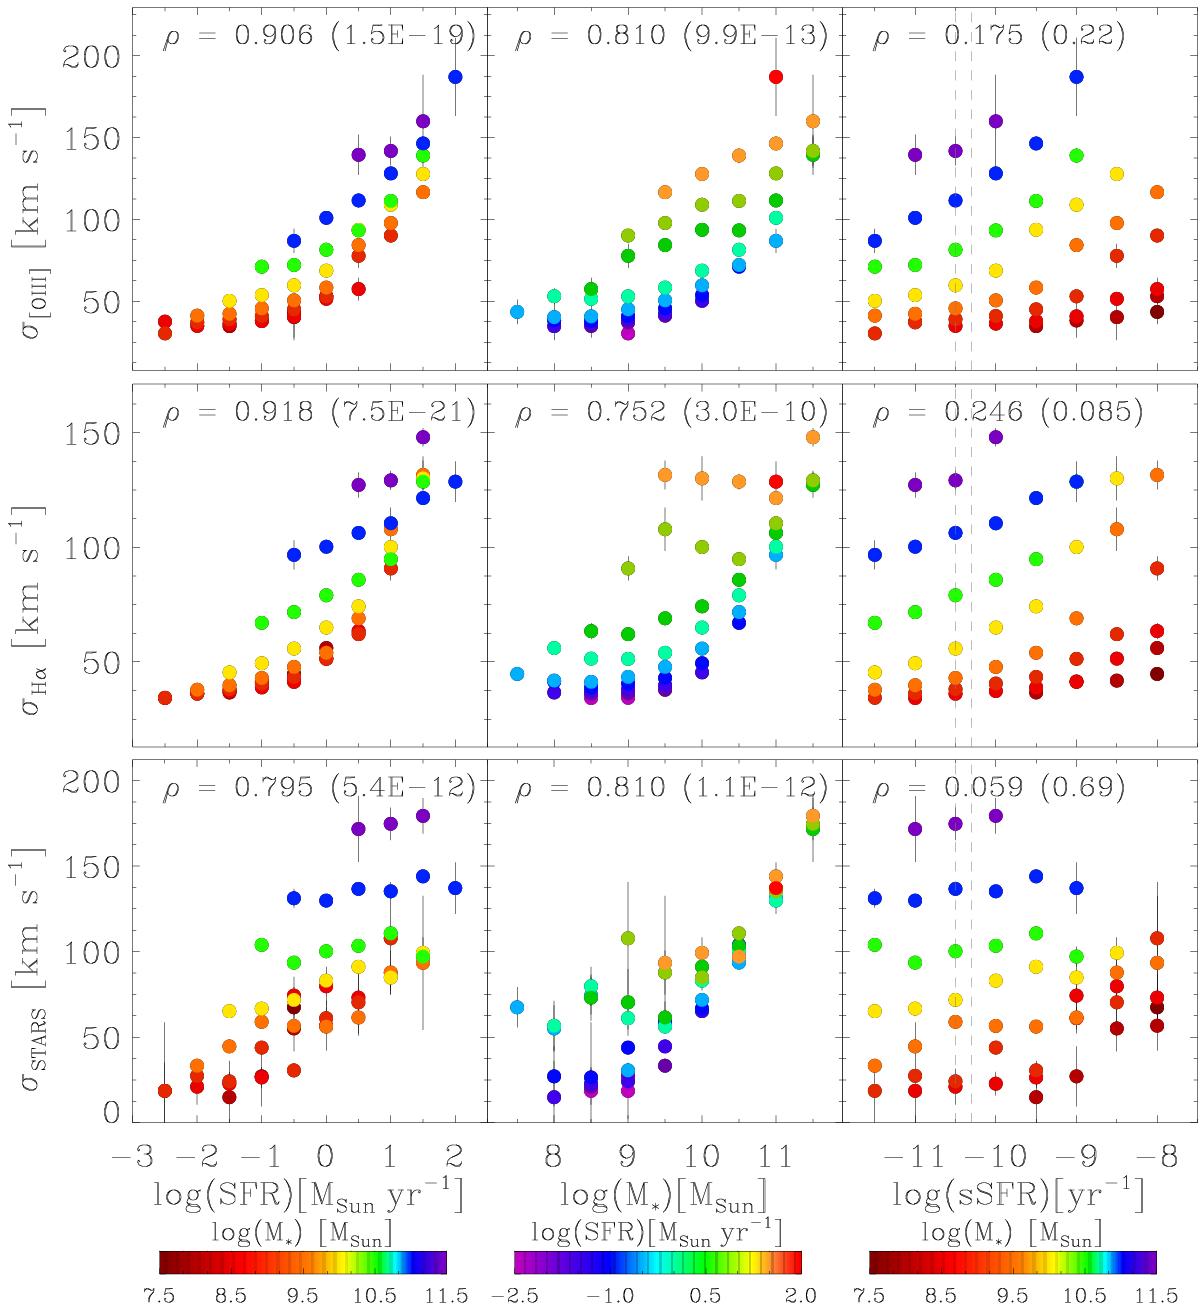
Line-of-sight velocity dispersion of the ionised gas as traced by the [OIII] (top panel) and Hα (middle panel) emission lines and of the stars (bottom panel). The errors were obtained by applying the bootstrap method, as explained in the text. The grey dashed lines in the third column outline the sSFR range corresponding to the MS of local star-forming galaxies between 9.0 ≤ log (M∗ [M⊙] ) ≤ 11.0. The Spearman rank correlation coefficient (0 <ρ< 1, higher values of ρ indicate stronger correlation) is reported in each plot, along with the corresponding two-sided p-value as given in parenthesis (if the p value is ≤α, where α = 0.05 is the level of significance, the observed correlation is statistically significant).
Current usage metrics show cumulative count of Article Views (full-text article views including HTML views, PDF and ePub downloads, according to the available data) and Abstracts Views on Vision4Press platform.
Data correspond to usage on the plateform after 2015. The current usage metrics is available 48-96 hours after online publication and is updated daily on week days.
Initial download of the metrics may take a while.