Free Access
Fig. 13
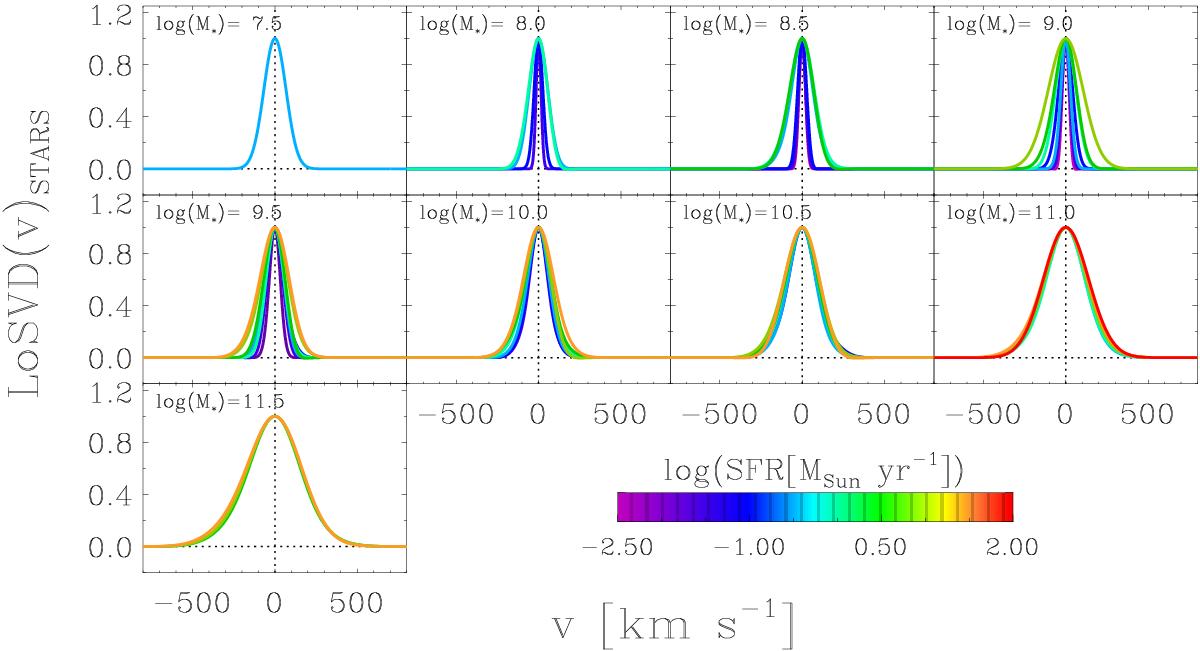
Line-of-sight velocity distribution of the stars. In each panel we have over-plotted the LoSVDs of galaxy bins identified by the same (average) M∗ and by different (average) SFRs, colour-coded by their SFR.
Current usage metrics show cumulative count of Article Views (full-text article views including HTML views, PDF and ePub downloads, according to the available data) and Abstracts Views on Vision4Press platform.
Data correspond to usage on the plateform after 2015. The current usage metrics is available 48-96 hours after online publication and is updated daily on week days.
Initial download of the metrics may take a while.