Fig. 1
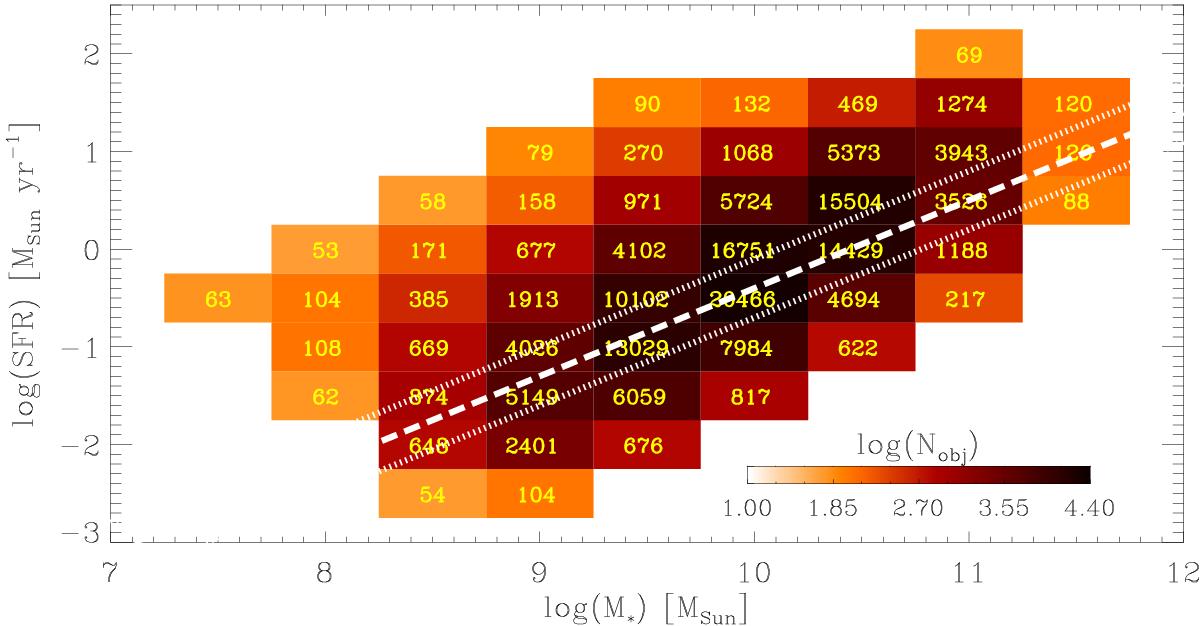
SDSS sample of star-forming, inactive galaxies selected for this study, plotted in the M∗−SFR parameter space. The grid of 50 bins used for the stacking is shown, with the bins colour-coded according to the number of spectra enclosed. The exact number of sources within each bin is indicated by the yellow text. The white dashed and dotted lines represent the MS relation of local star-forming galaxies with its ± 1σ scatter (=0.3 dex). The MS relation has been taken from Peng et al. (2010) and adapted to this dataset as explained in Sect. 2.2.
Current usage metrics show cumulative count of Article Views (full-text article views including HTML views, PDF and ePub downloads, according to the available data) and Abstracts Views on Vision4Press platform.
Data correspond to usage on the plateform after 2015. The current usage metrics is available 48-96 hours after online publication and is updated daily on week days.
Initial download of the metrics may take a while.