Fig. 8
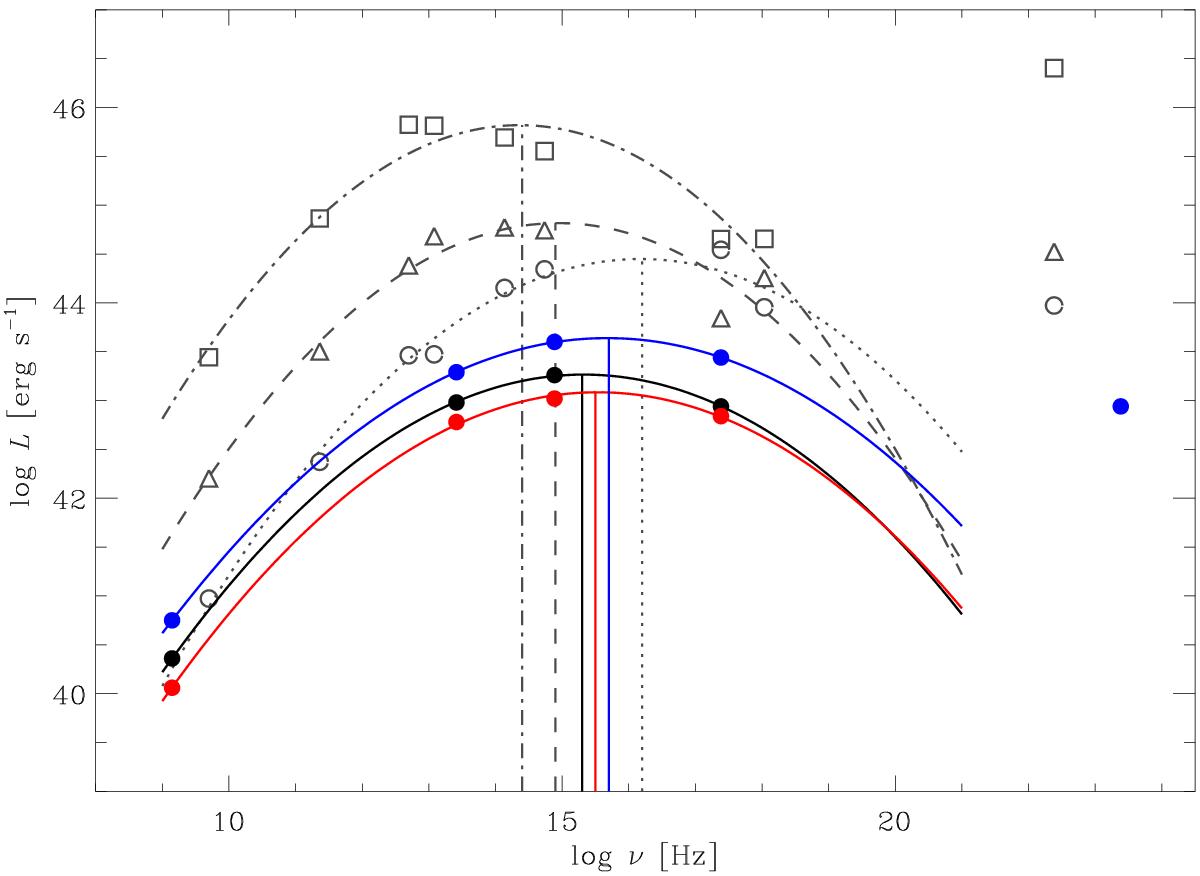
Median SED for the 34 objects analyzed in this paper (black dots). The red and blue dots represent the SEDs obtained by splitting the sample into two groups of increasing radio luminosities (see text and Table 3). Gray symbols refer to the SEDs of the three faintest subsamples in the F98 work, complemented by the hard X-ray data points from Donato et al. (2001). The curves are log-parabolic fits to the radio-to-X-ray median luminosities with the peak indicated with vertical lines.
Current usage metrics show cumulative count of Article Views (full-text article views including HTML views, PDF and ePub downloads, according to the available data) and Abstracts Views on Vision4Press platform.
Data correspond to usage on the plateform after 2015. The current usage metrics is available 48-96 hours after online publication and is updated daily on week days.
Initial download of the metrics may take a while.