Fig. 7
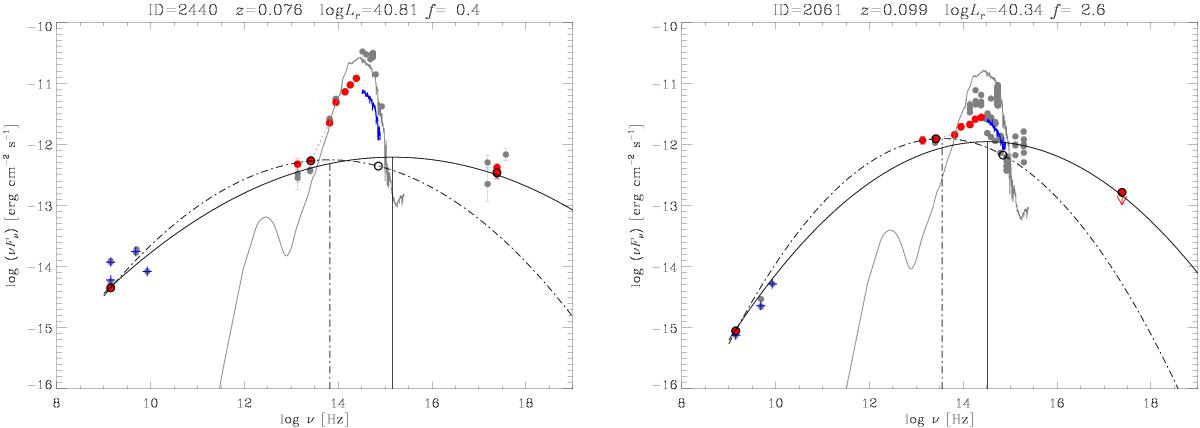
Examples of the SED of two LPBLs, namely ID=2440 and ID=2061. The solid line represents a logarithmic parabolic fit, including the radio, infrared, optical, and X-ray data points, which does not match the infrared and optical data. These are instead well reproduced by a three-point fit excluding the X-ray datum (dot-dashed line). The case shown in the left panel indicates that the X-ray emission is likely dominated by the inverse-Compton component; that in the right panel highlights how the upper limit to the X-ray flux leads to a large overestimate of the synchrotron peak frequency. The grey line represents an elliptical galaxy template normalized in W2 and the grey dots show data collected from the ASDC.
Current usage metrics show cumulative count of Article Views (full-text article views including HTML views, PDF and ePub downloads, according to the available data) and Abstracts Views on Vision4Press platform.
Data correspond to usage on the plateform after 2015. The current usage metrics is available 48-96 hours after online publication and is updated daily on week days.
Initial download of the metrics may take a while.