Fig. 5
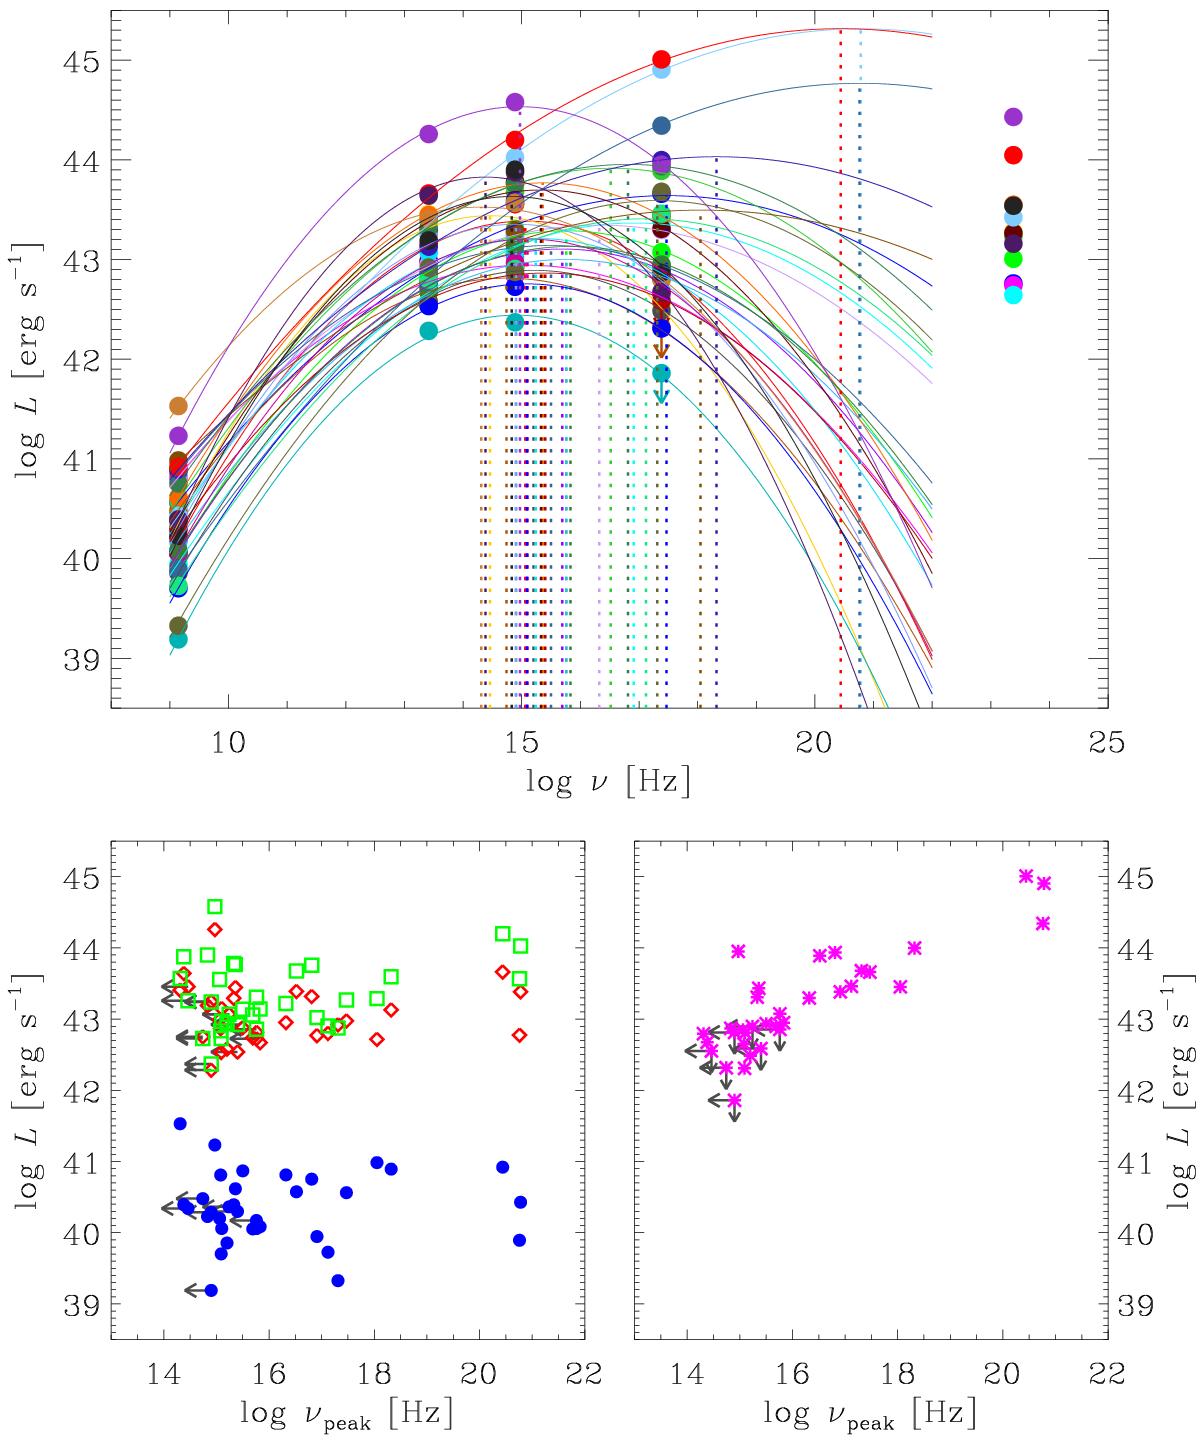
Upper panel: radio-to-γ-ray SEDs for the 34 objects analyzed in this paper (colored dots). Solid lines represent parabolic fits to the radio-X-ray data. Vertical dotted lines identify the parabola apices, which give an indication of the synchrotron peak position. For the objects without X-ray detection, the peak location should be considered an upper limit. Lower panels: luminosities versus the synchrotron peak frequency. Blue dots, red diamonds, green squares, and pink asterisks refer to radio, infrared, optical, and X-ray bands, respectively. In all panels, upper limits due to the lack of detection in the X-ray band are indicated with arrows.
Current usage metrics show cumulative count of Article Views (full-text article views including HTML views, PDF and ePub downloads, according to the available data) and Abstracts Views on Vision4Press platform.
Data correspond to usage on the plateform after 2015. The current usage metrics is available 48-96 hours after online publication and is updated daily on week days.
Initial download of the metrics may take a while.