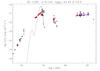
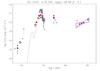
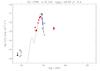
Fig. A.1
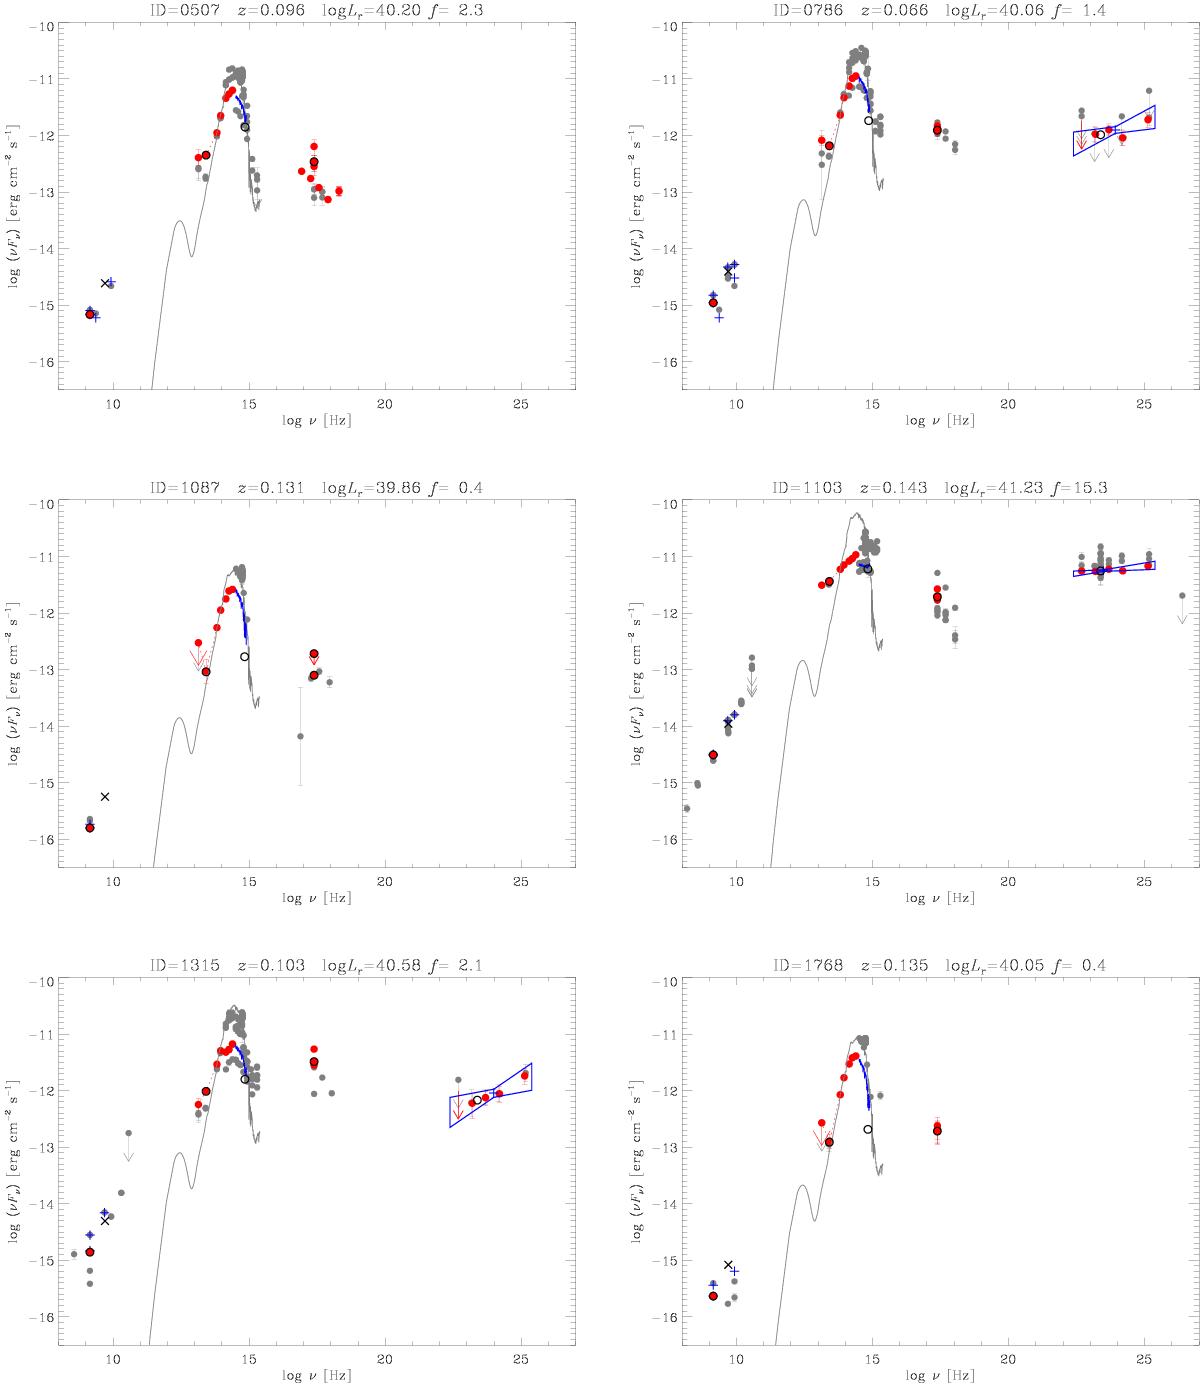
Broadband SEDs of the 34 LPBLs analysed in this paper. Red dots represent flux densities derived from the FIRST, AllWISE, 2MASS, RASS, 3XMM, and 3FGL catalogs. Blue plus signs show other radio data and the γ-ray flux density at the pivot energy; the black crosses represent the 1.4 GHz FIRST data converted into 5 GHz ones with αr = 0. The SDSS spectrum and the Fermi power-law fit butterfly are plotted in blue. Near-infrared, optical, and X-ray data have been corrected for Galactic absorption. The black circles highlight the reference radio (1.4 GHz), infrared (W3 band), optical (3900 Å rest-frame), X-ray (1 keV), and γ-ray (1 GeV) jet flux densities. In the W3 band, the jet flux density has been corrected for the host contamination estimated from an elliptical galaxy template (grey line) normalized in the W2 band. In the optical, the jet contribution has been derived from the Dn(4000). Grey dots show data downloaded from the ASDC.
Current usage metrics show cumulative count of Article Views (full-text article views including HTML views, PDF and ePub downloads, according to the available data) and Abstracts Views on Vision4Press platform.
Data correspond to usage on the plateform after 2015. The current usage metrics is available 48-96 hours after online publication and is updated daily on week days.
Initial download of the metrics may take a while.