Free Access
Fig. 4
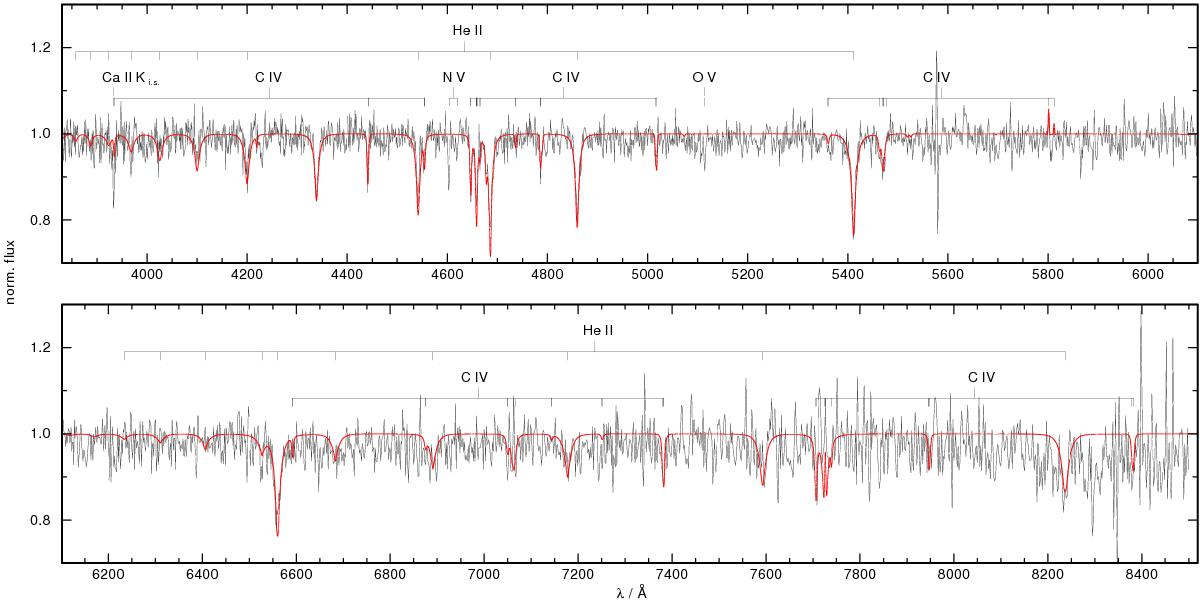
Coadded and normalized SDSS spectrum (gray) of the PG 1159 star SDSS J155610.40+254640.3. The best fit model (red) including He and C lines is superimposed and the positions of identified spectral lines are indicated.
Current usage metrics show cumulative count of Article Views (full-text article views including HTML views, PDF and ePub downloads, according to the available data) and Abstracts Views on Vision4Press platform.
Data correspond to usage on the plateform after 2015. The current usage metrics is available 48-96 hours after online publication and is updated daily on week days.
Initial download of the metrics may take a while.