Fig. 4
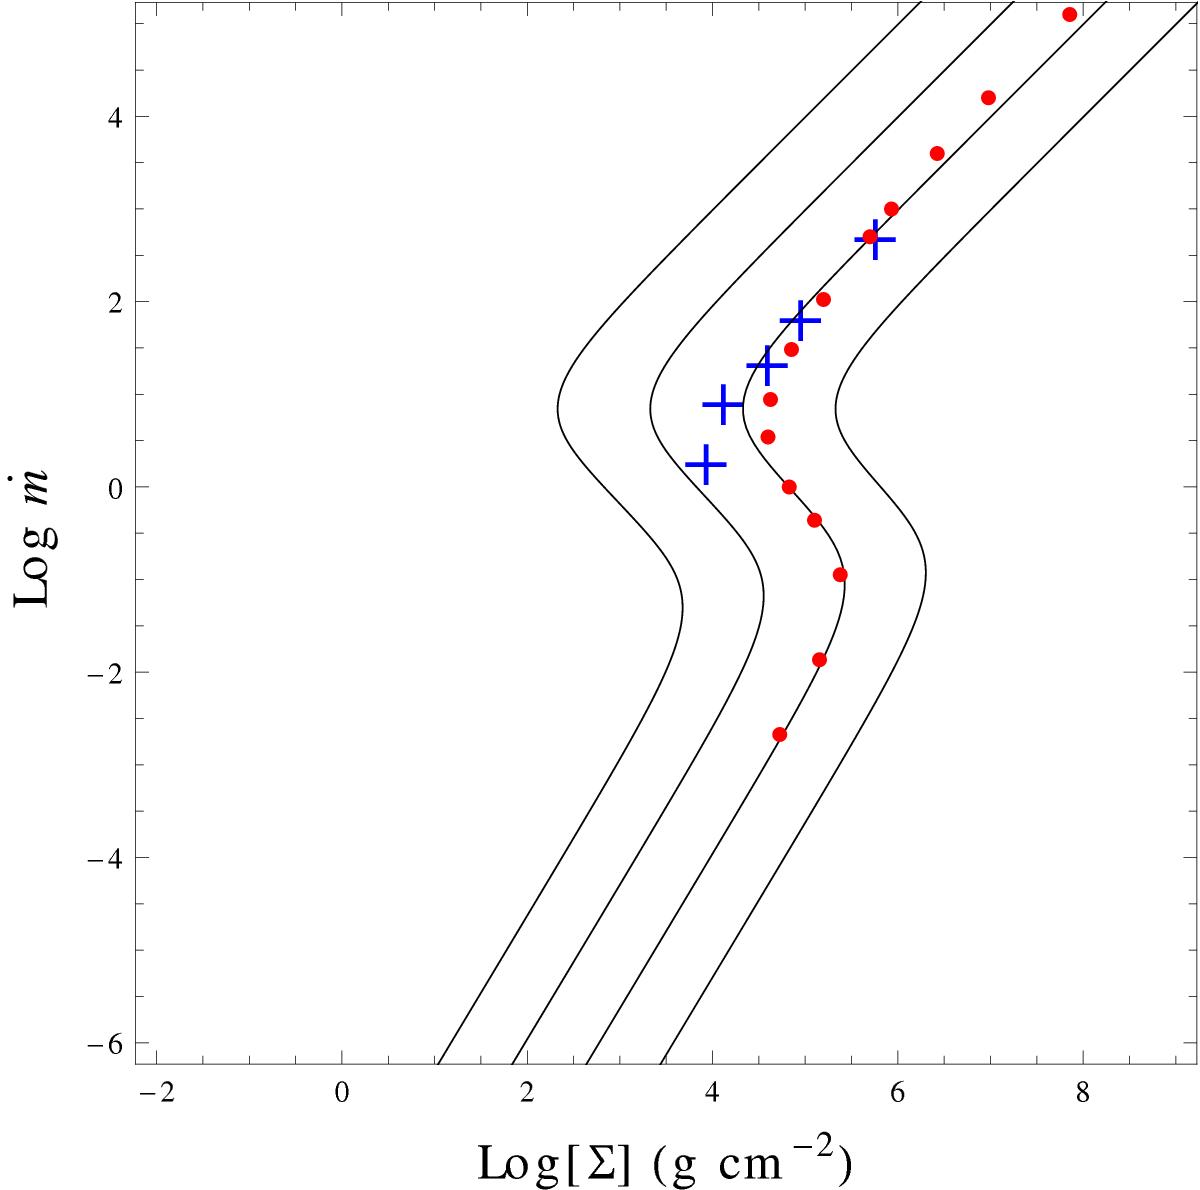
Thermal equilibrium (ṁ–Σ) diagram for R = 30 M. Solutions based on different assumptions are compared. Black lines show analytical S-curves for Keplerian motion in the Paczyński-Wiita potential with ξ = 1 and α = 1;0.1;0.01;0.001 (left to right). Red dots represent stationary numerical slim discs for different accretion rates, with α = 0.01 (Sect. 3). Blue crosses correspond to GRRMHD simulations (see Table 1 and Sect. 4). All solutions have M = 10 M⊙.
Current usage metrics show cumulative count of Article Views (full-text article views including HTML views, PDF and ePub downloads, according to the available data) and Abstracts Views on Vision4Press platform.
Data correspond to usage on the plateform after 2015. The current usage metrics is available 48-96 hours after online publication and is updated daily on week days.
Initial download of the metrics may take a while.