Fig. 2
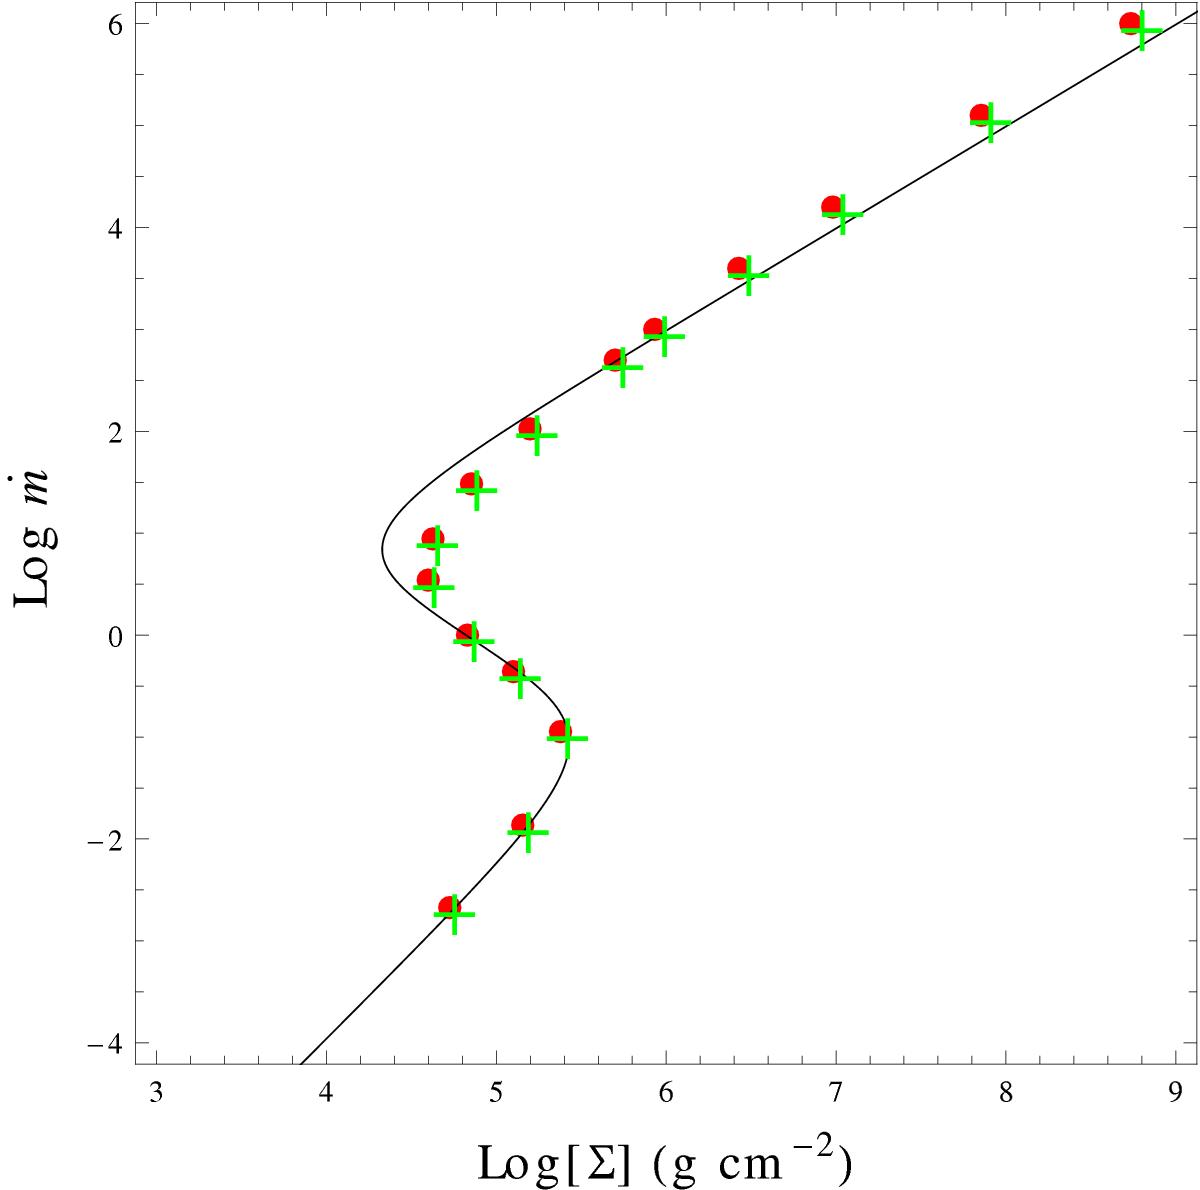
Thermal equilibrium (ṁ–Σ) diagram for slim-disc solutions at R = 30 M. Red dots: Numerical solutions from the slim-disc code (Sa¸dowski 2011). Black line: analytical S-curve, obtained from the Paczyński-Wiita potential. Both sets have M = 10 M⊙ and α = 0.01. The analytical S-curve has also ξ = 1, Ω/ΩK = 1. Green crosses: obtained from the Paczyński-Wiita potential but with the same ξ, Ω/ΩK values as the corresponding slim-disc simulations. Although the black line does deviate from the red points, we see that when the above corrections are taken into account, the analytical pseudo-Newtonian slim discs agree with the stationary, general relativistic, “1+1” simulations with great precision.
Current usage metrics show cumulative count of Article Views (full-text article views including HTML views, PDF and ePub downloads, according to the available data) and Abstracts Views on Vision4Press platform.
Data correspond to usage on the plateform after 2015. The current usage metrics is available 48-96 hours after online publication and is updated daily on week days.
Initial download of the metrics may take a while.