Fig. 8
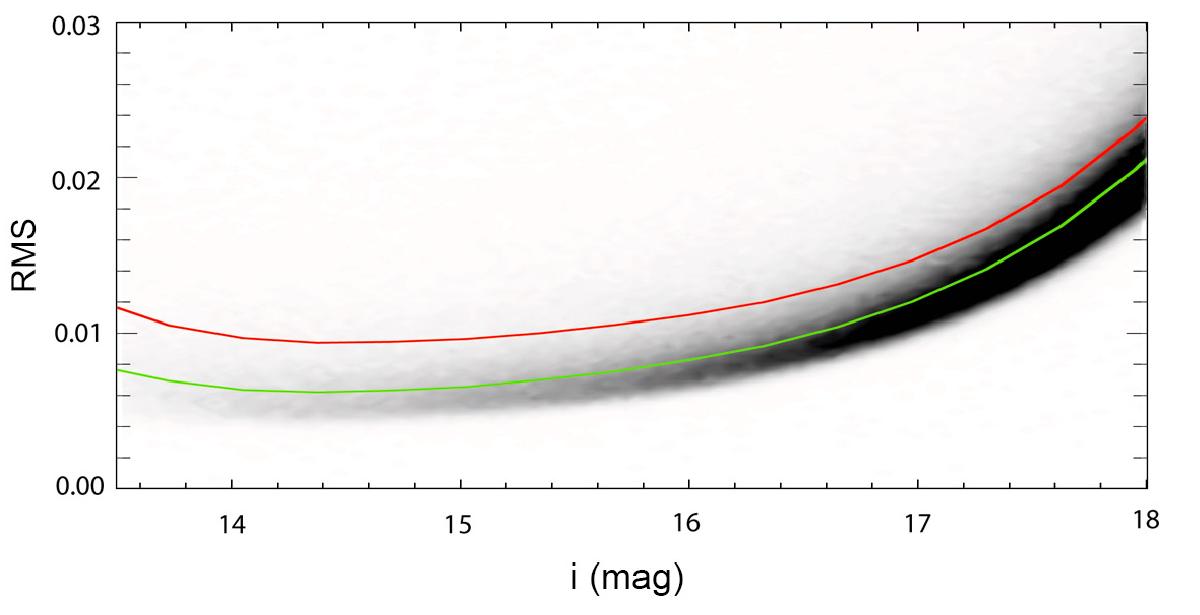
Density plot of rms against the i-band magnitude in the central field after iterative clipping of 5σ outliers and application of the sysrem algorithm. The green line shows the median values in 0.2 mag bins, the red line the values before application of sysrem. Note that the phase is shifted by 0.5 units for better readability.
Current usage metrics show cumulative count of Article Views (full-text article views including HTML views, PDF and ePub downloads, according to the available data) and Abstracts Views on Vision4Press platform.
Data correspond to usage on the plateform after 2015. The current usage metrics is available 48-96 hours after online publication and is updated daily on week days.
Initial download of the metrics may take a while.