Fig. 6
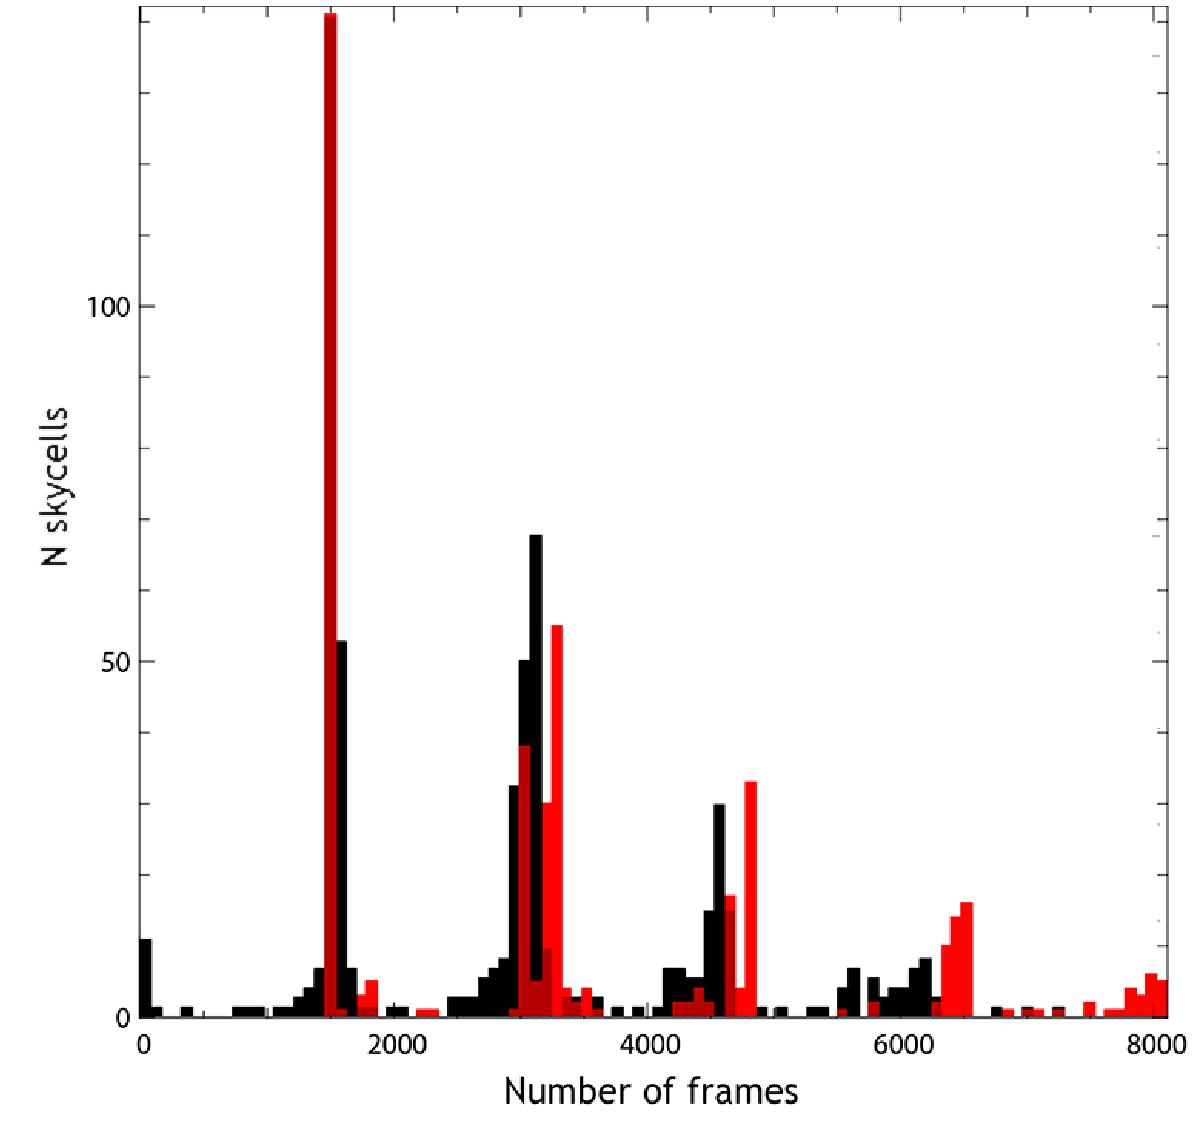
Histogram of the number of frames per skycell, of which there are 420 overall. In red we show the distribution per skycell before ingesting the images into the pipeline, in black after ingesting. One can see that the smallest overlapping region completely vanishes and only a small fraction of skycells with about 6000 frames remains.
Current usage metrics show cumulative count of Article Views (full-text article views including HTML views, PDF and ePub downloads, according to the available data) and Abstracts Views on Vision4Press platform.
Data correspond to usage on the plateform after 2015. The current usage metrics is available 48-96 hours after online publication and is updated daily on week days.
Initial download of the metrics may take a while.