Fig. 27
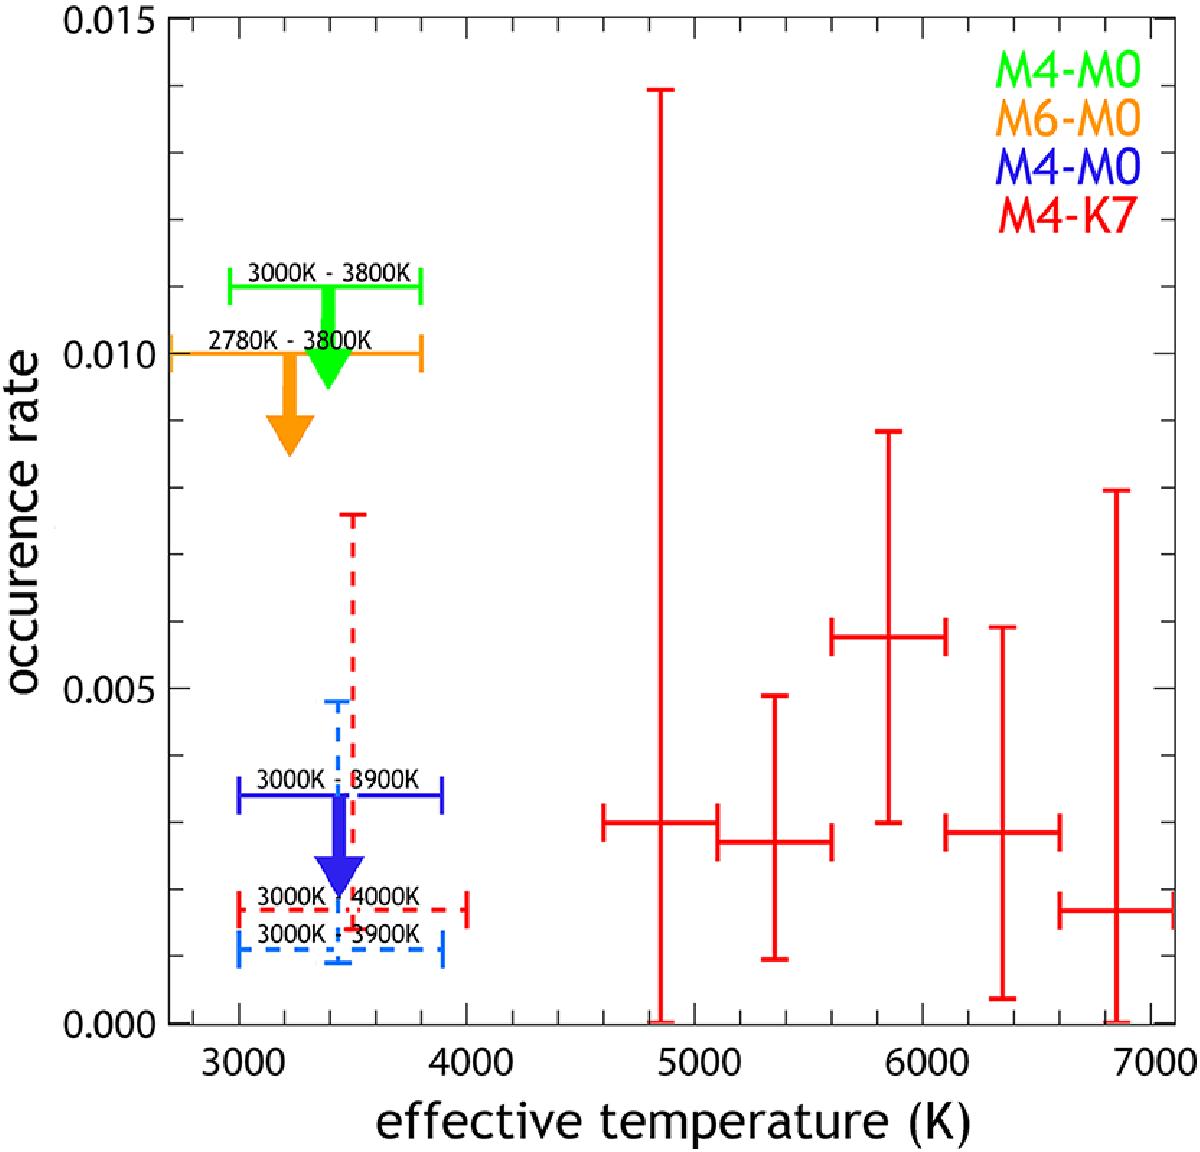
Adaptation of Fig. 13 in Kovács et al. (2013), showing the hot Jupiter fractions determined by different surveys. We added our new results, marked in dark blue (upper limit) and light blue dotted line (fraction in case of a successful detection). Orange shows the limits derived from radial velocity surveys (Bonfils et al. 2013), red from the Kepler survey (extracted by Kovács et al. 2013), red in dotted lines from our own simulations for Kepler and green from the WFCAM transit survey (Zendejas Dominguez et al. 2013).
Current usage metrics show cumulative count of Article Views (full-text article views including HTML views, PDF and ePub downloads, according to the available data) and Abstracts Views on Vision4Press platform.
Data correspond to usage on the plateform after 2015. The current usage metrics is available 48-96 hours after online publication and is updated daily on week days.
Initial download of the metrics may take a while.