Fig. 26
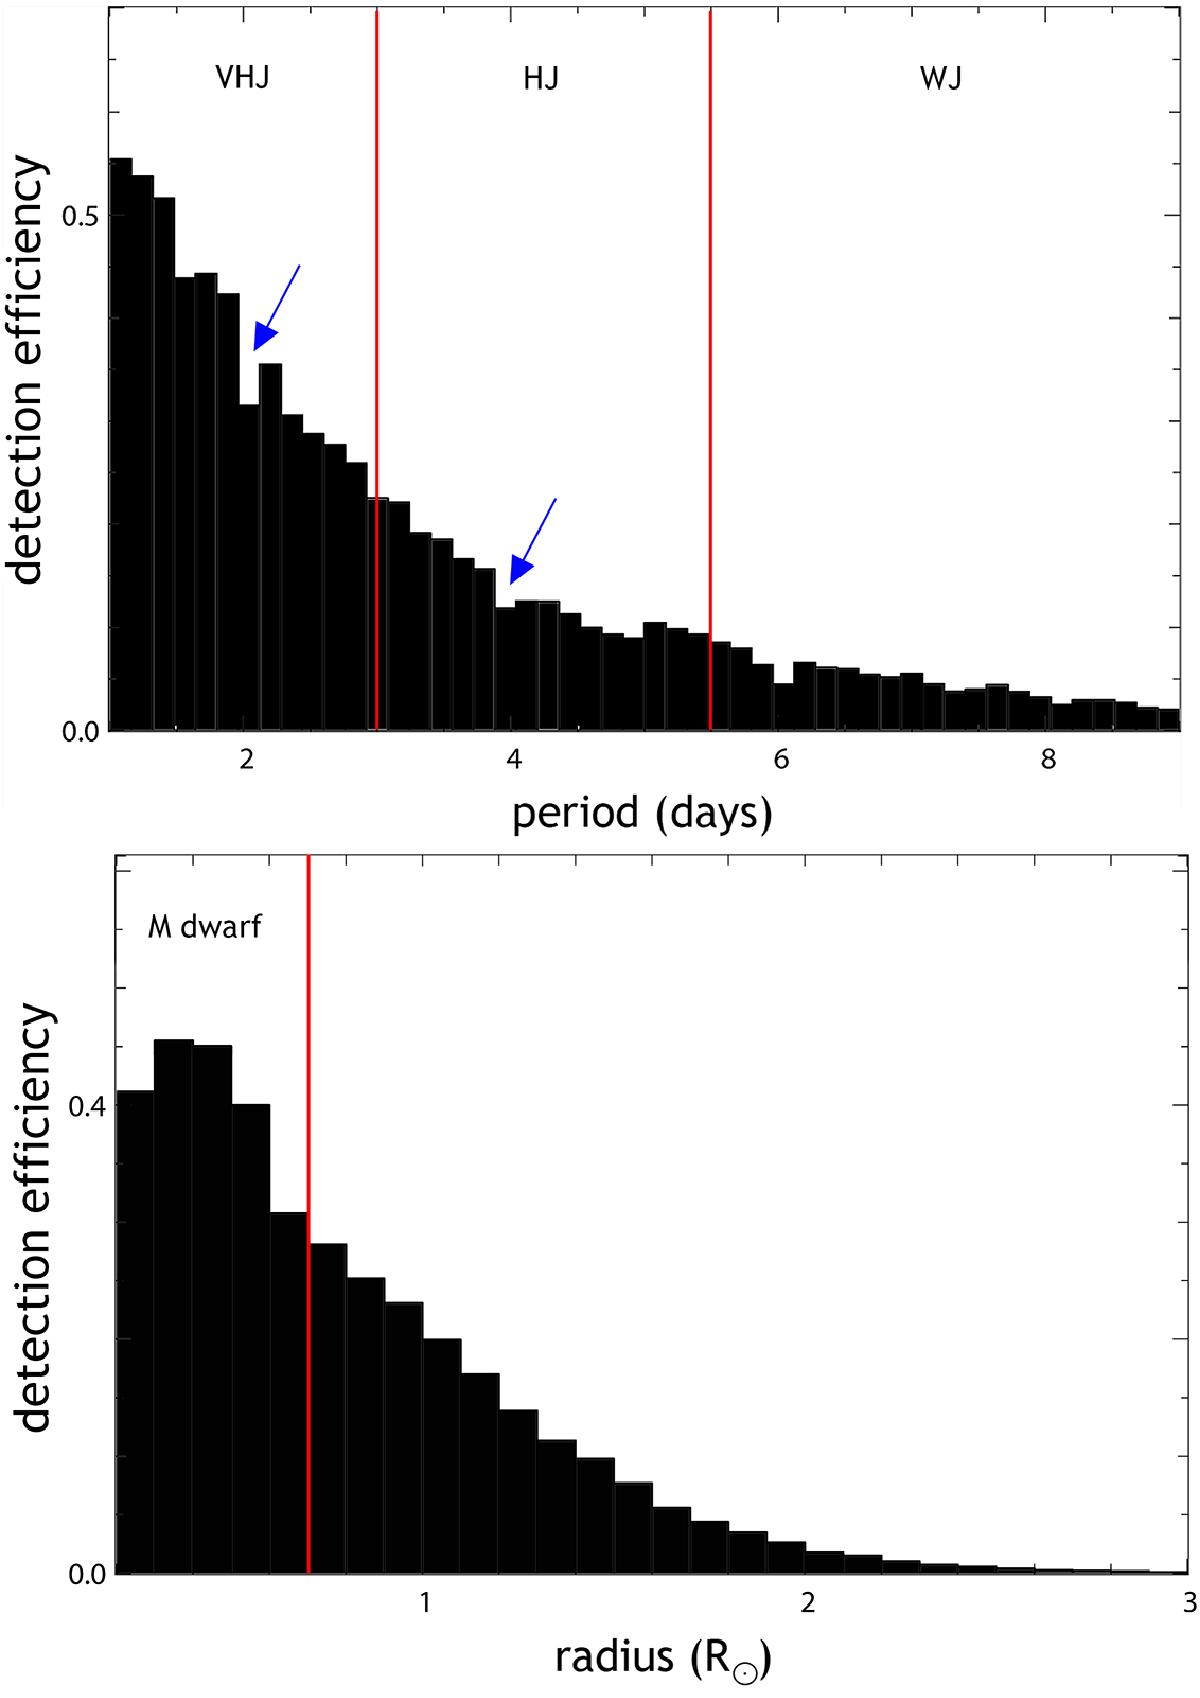
Top: detected period against detection efficiency for all hot Jupiter populations around M dwarfs (divided by red lines). One can see two gaps at 1.6 and 4.0 days, resulting from our alias detection removal (blue arrows). Bottom: histogram of stellar radius against detection efficiency. We combined the results from the M dwarf VHJ simulation and the VHJ simulations for hotter dwarf stars (divided by red line).
Current usage metrics show cumulative count of Article Views (full-text article views including HTML views, PDF and ePub downloads, according to the available data) and Abstracts Views on Vision4Press platform.
Data correspond to usage on the plateform after 2015. The current usage metrics is available 48-96 hours after online publication and is updated daily on week days.
Initial download of the metrics may take a while.