Fig. 20
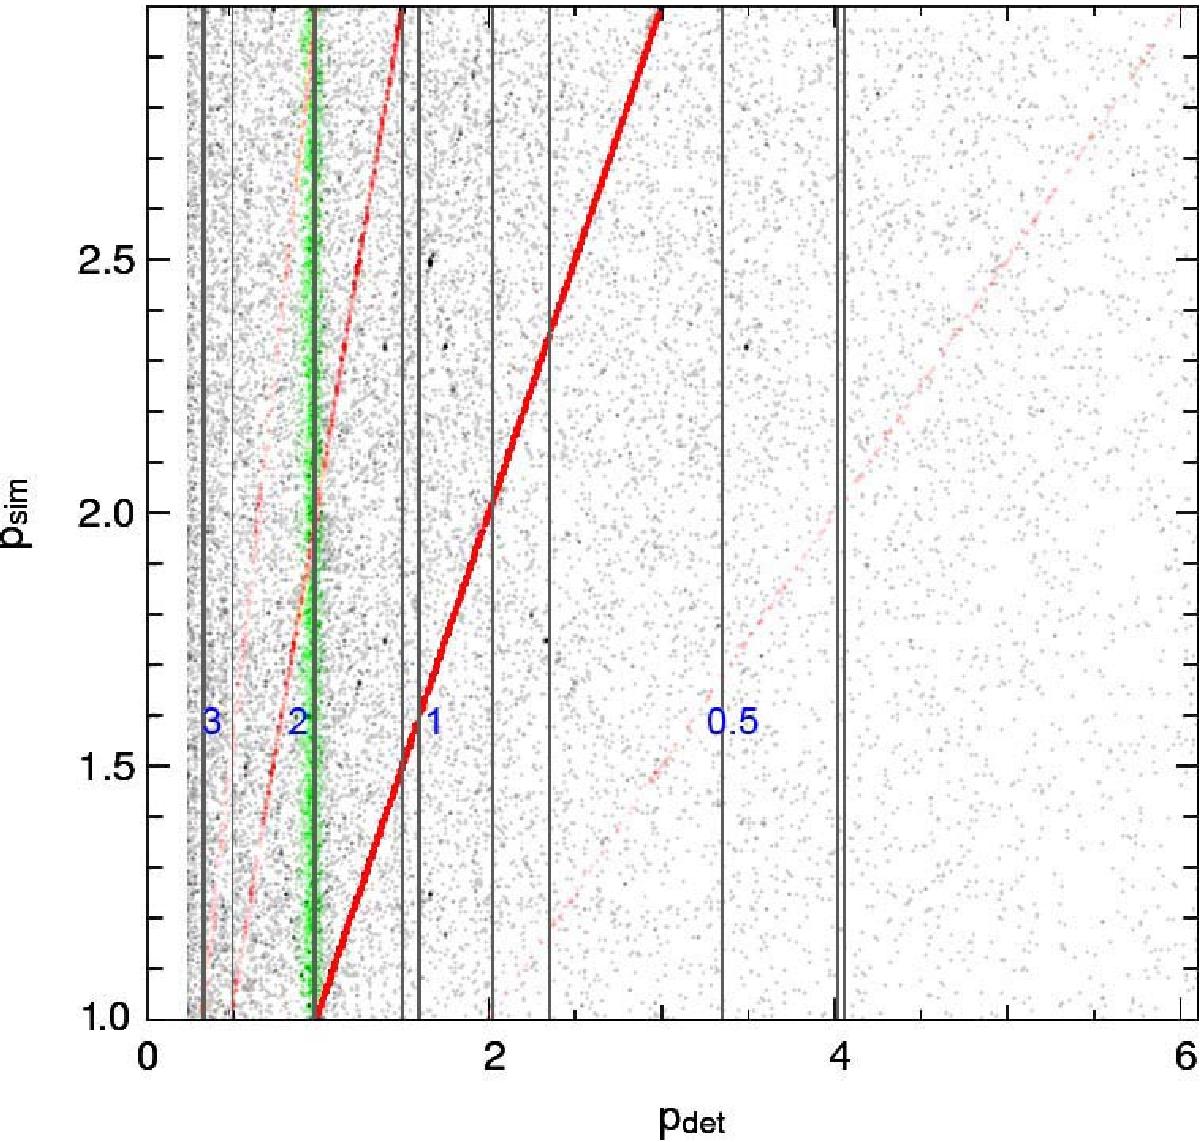
Density plot of simulated period psim against detected period pdet for Jovian planets with periods between 1–3 days after application of our alias removal. Marked in red are the lines for correct period identification and corresponding aliases (blue number) or half, double and triple the simulated period. Further marked in green is a period area with a high amount of false detection contaminations, removed period regions (see Table 3) are marked as horizontal grey lines.
Current usage metrics show cumulative count of Article Views (full-text article views including HTML views, PDF and ePub downloads, according to the available data) and Abstracts Views on Vision4Press platform.
Data correspond to usage on the plateform after 2015. The current usage metrics is available 48-96 hours after online publication and is updated daily on week days.
Initial download of the metrics may take a while.