Fig. 2
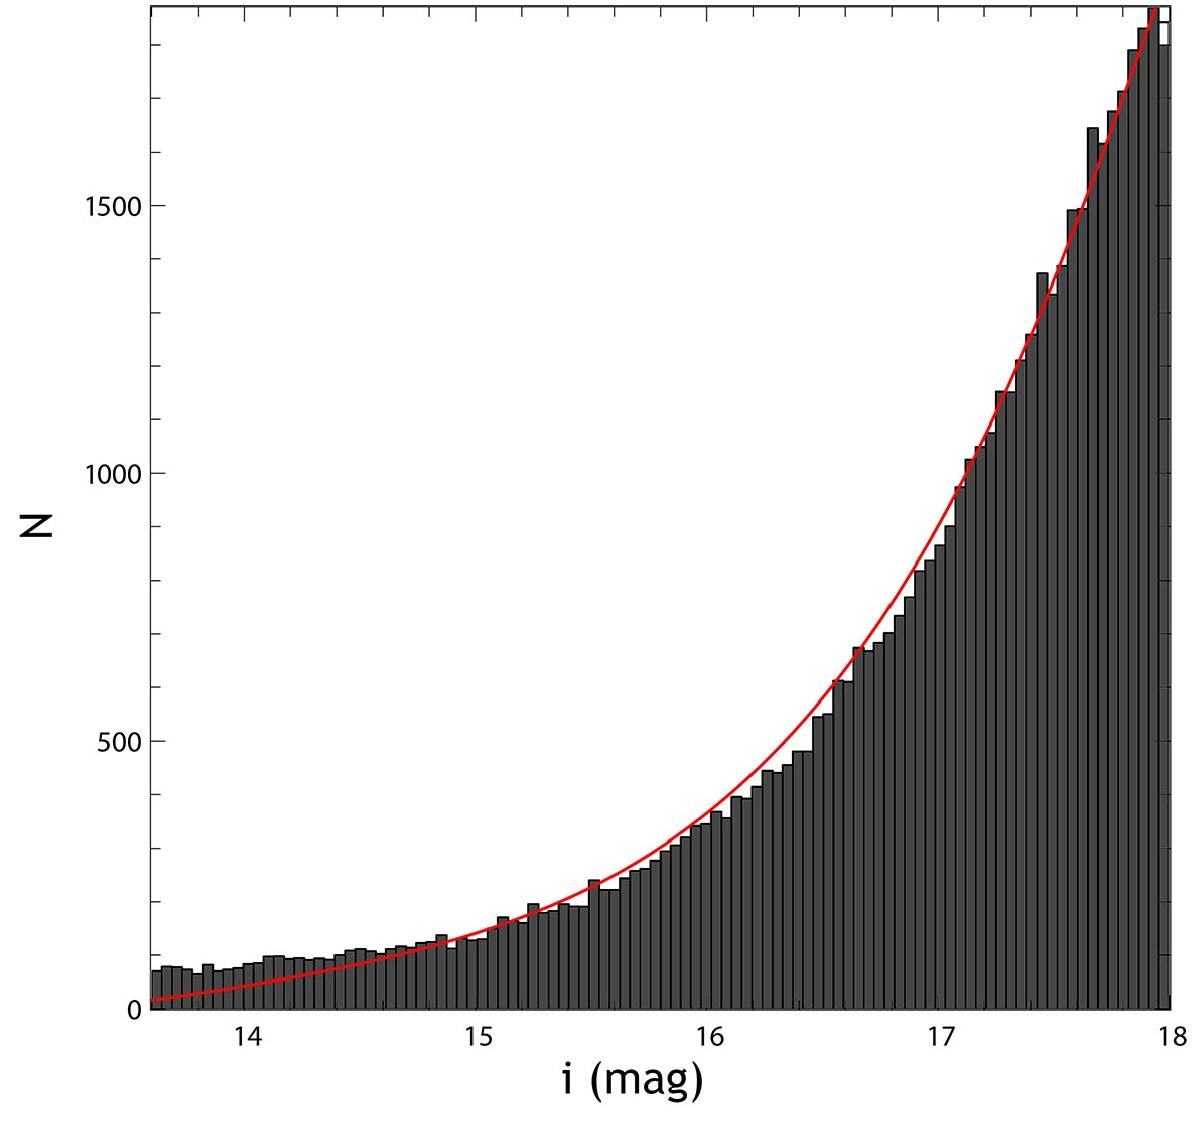
Histogram with 100 bins of the brightness distribution in our M dwarf sample. The red line shows the distribution according to the Besançon model (Robin et al. 2003). Our fields include more bright stars than predicted by the Besançon model, but the number of stars is in good agreement for stars with magnitudes i′ ≥ 14.5 mag. We further detail our stellar classification method in Sect. 3.
Current usage metrics show cumulative count of Article Views (full-text article views including HTML views, PDF and ePub downloads, according to the available data) and Abstracts Views on Vision4Press platform.
Data correspond to usage on the plateform after 2015. The current usage metrics is available 48-96 hours after online publication and is updated daily on week days.
Initial download of the metrics may take a while.