Free Access
Fig. 15
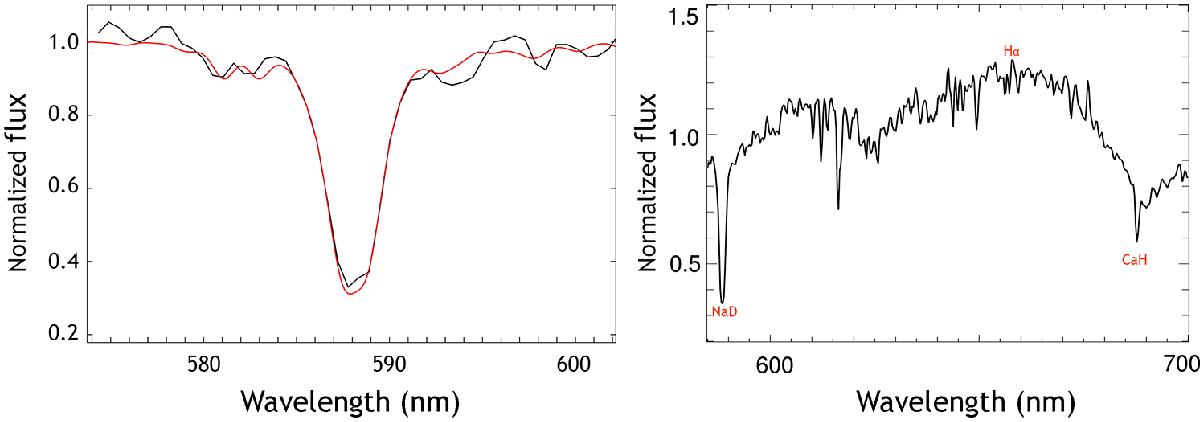
Left: best spectral fit (red) of the Na I line taken with the Otto Struve 2.1 m ES2 low resolution spectrograph (black). Right: complete spectrum recorded with the ES2 spectrograph with spectral features marked in red.
Current usage metrics show cumulative count of Article Views (full-text article views including HTML views, PDF and ePub downloads, according to the available data) and Abstracts Views on Vision4Press platform.
Data correspond to usage on the plateform after 2015. The current usage metrics is available 48-96 hours after online publication and is updated daily on week days.
Initial download of the metrics may take a while.