Fig. 9
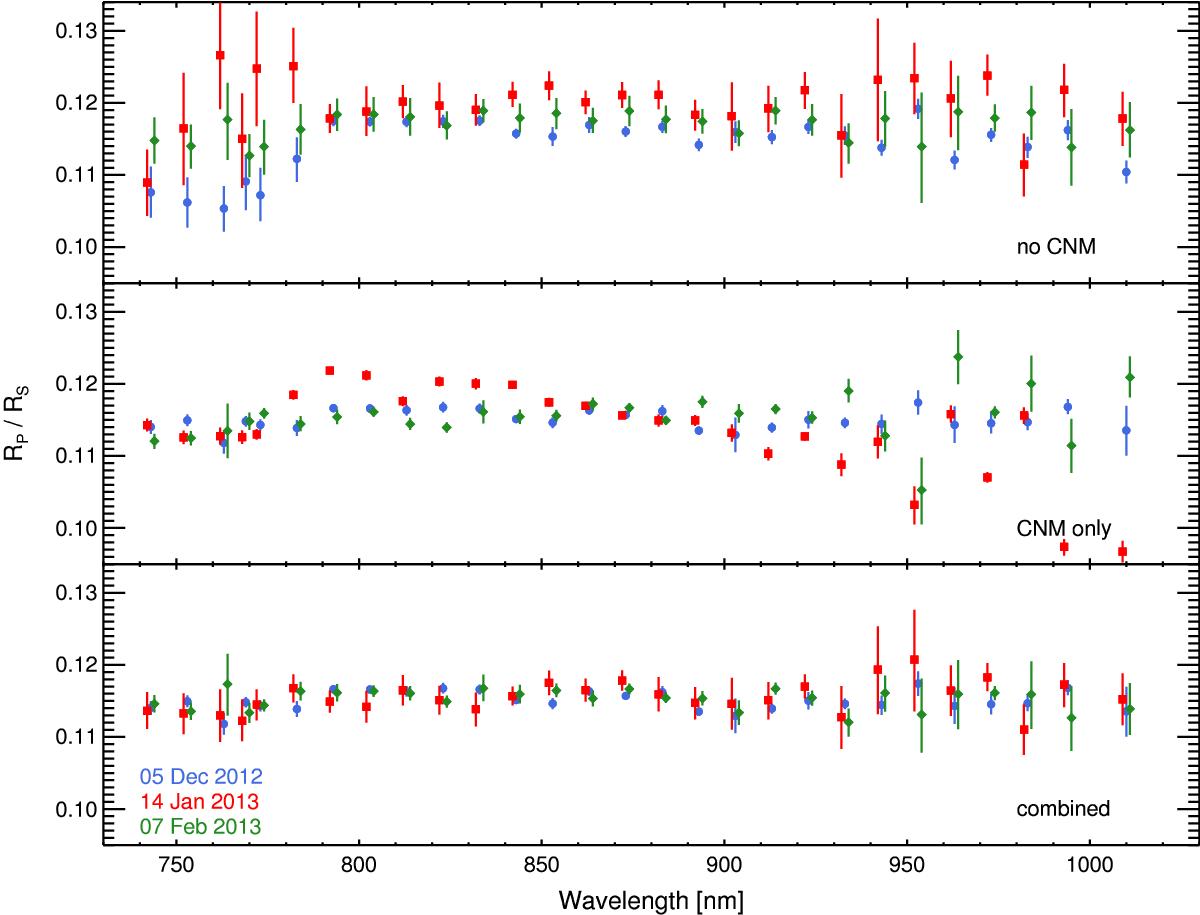
FORS2 transmission spectra of the three dates obtained with three baseline modeling approaches: no CNM, but parametrizations of external parameters as given in Sect. 3.2.2 (top), CNM alone (middle), and CNM together with basic parametrizations as detailed in Sect. 3.2.2 (bottom). Blue filled circles denote the FORS2 transmission spectrum of 5 December 2012, red squares that of 14 January 2013, and green diamonds that of 7 February 2013. In this plot, the spectra of 14 January 2013 and 7 February 2013 are offset from their nominal wavelengths by 1 nm to avoid overlaps.
Current usage metrics show cumulative count of Article Views (full-text article views including HTML views, PDF and ePub downloads, according to the available data) and Abstracts Views on Vision4Press platform.
Data correspond to usage on the plateform after 2015. The current usage metrics is available 48-96 hours after online publication and is updated daily on week days.
Initial download of the metrics may take a while.