Fig. 8
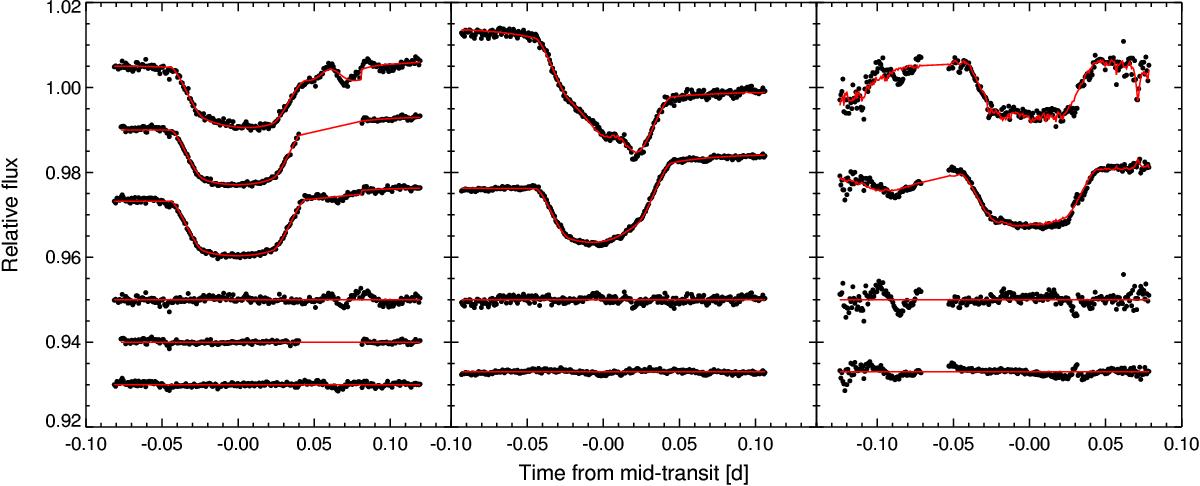
FORS2 spectrophotometry and residuals obtained from using a single bin for each light curve subset, as described in Sect. 3.2.1. The three subsets of 5 December 2012 are shown in the left panel and correspond to wavelength ranges of (from top to bottom) 738−788, 788−898, and 898−1020 nm. The middle and right panels show the two subsets of 14 January 2013 and 7 February 2013, respectively, and correspond to wavelength ranges of (from top to bottom) 738−788, and 788−1020 nm. The models are shown as red solid lines and contain the parametrizations of external parameters as described in Table 2. The residuals are shown below the data which are partially offset for clarity.
Current usage metrics show cumulative count of Article Views (full-text article views including HTML views, PDF and ePub downloads, according to the available data) and Abstracts Views on Vision4Press platform.
Data correspond to usage on the plateform after 2015. The current usage metrics is available 48-96 hours after online publication and is updated daily on week days.
Initial download of the metrics may take a while.