Fig. 11
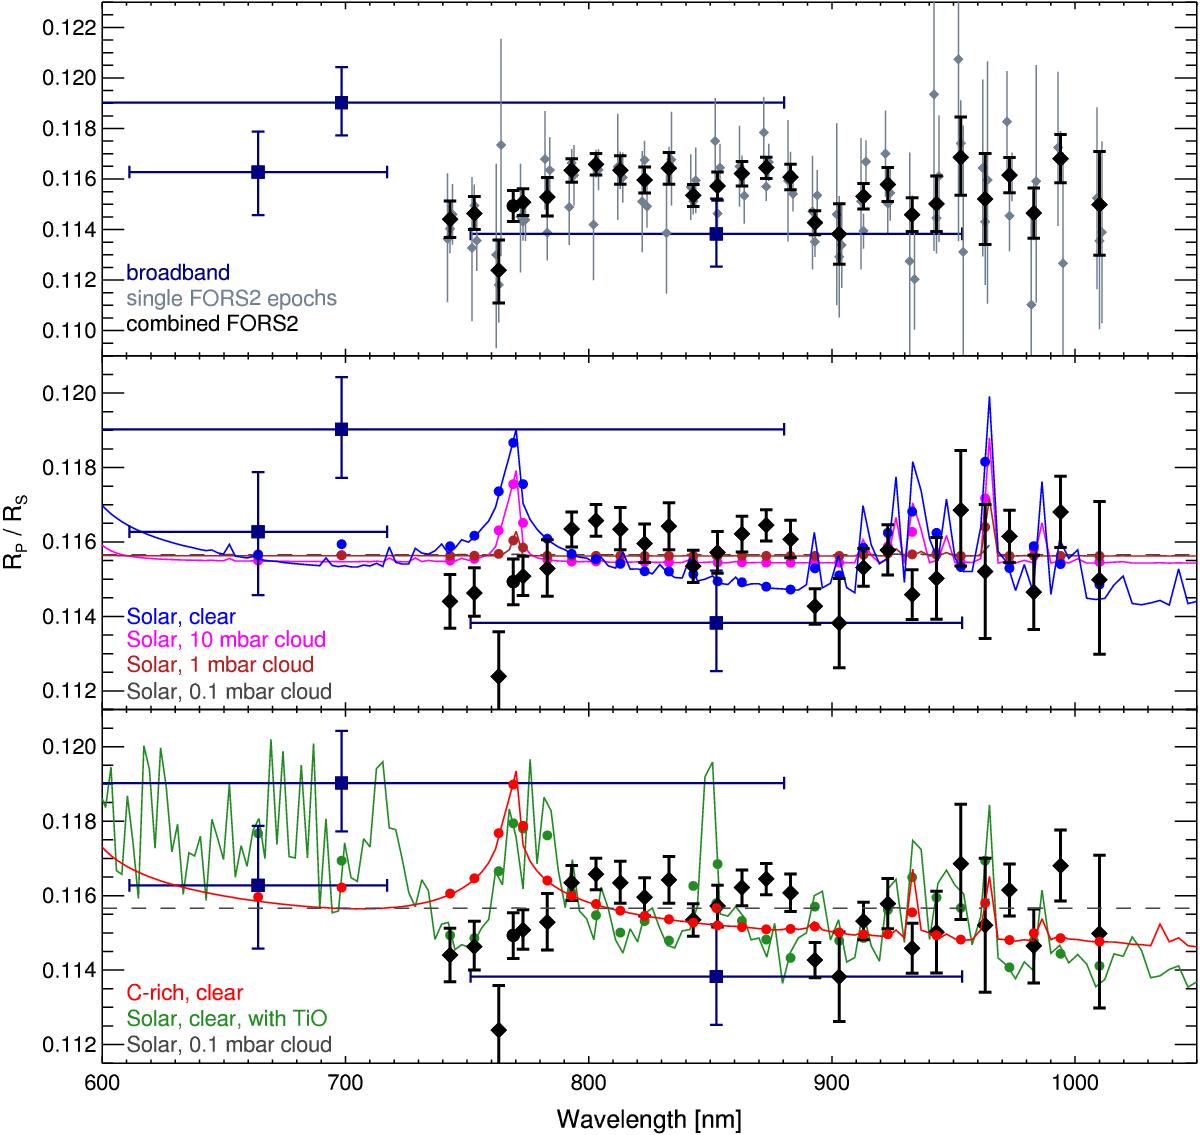
Transmission spectrum of WASP-49b as observed with FORS2, EulerCam and TRAPPIST compared to atmospheric models. Top: the FORS2 results of each separate data set are shown in gray and the results from the combined analysis are shown as black diamonds. The filled circle represents the data point centered on the K feature, and the results from broadband light curves are shown as dark blue squares. Center and bottom: the above transmission spectrum including the combined FORS2 and broadband data, together with predictions from atmosphere models. The model atmospheres are a clear solar-composition atmosphere (center panel, blue), a solar-composition atmosphere with a cloud deck at 10 mbar pressure (central panel, magenta), a solar-composition atmosphere with a cloud deck at 1 mbar pressure (central panel, dark red), a clear C-rich atmosphere (bottom panel, red), and a clear solar-composition atmosphere with TiO (bottom panel, green). A flat spectrum obtained from a solar-composition atmosphere with a cloud deck at 0.1 mbar pressure is shown as a gray dashed line in the middle and bottom panels. The filled circles show the models binned to the observed spectral resolution.
Current usage metrics show cumulative count of Article Views (full-text article views including HTML views, PDF and ePub downloads, according to the available data) and Abstracts Views on Vision4Press platform.
Data correspond to usage on the plateform after 2015. The current usage metrics is available 48-96 hours after online publication and is updated daily on week days.
Initial download of the metrics may take a while.