Free Access
Fig. 4
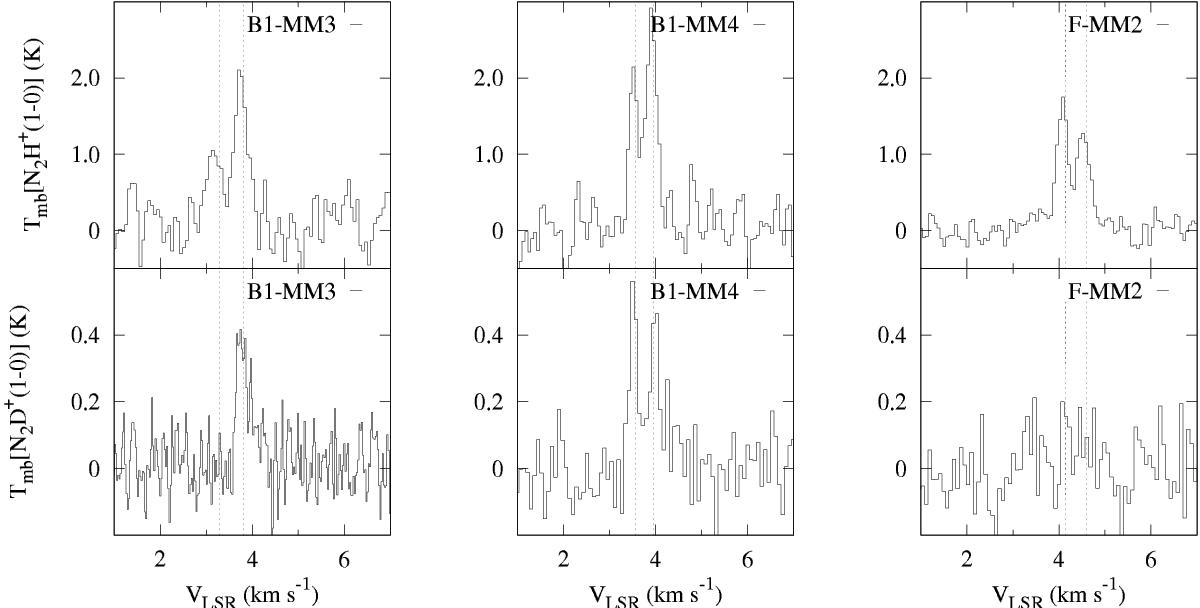
Isolated hyperfine components of N2H+ and N2D+ (1−0) towards cores where two velocity components are found. The spectra are centred at the frequency of the isolated component. The dotted lines show the centroid velocities of the N2H+(1−0) components.
Current usage metrics show cumulative count of Article Views (full-text article views including HTML views, PDF and ePub downloads, according to the available data) and Abstracts Views on Vision4Press platform.
Data correspond to usage on the plateform after 2015. The current usage metrics is available 48-96 hours after online publication and is updated daily on week days.
Initial download of the metrics may take a while.