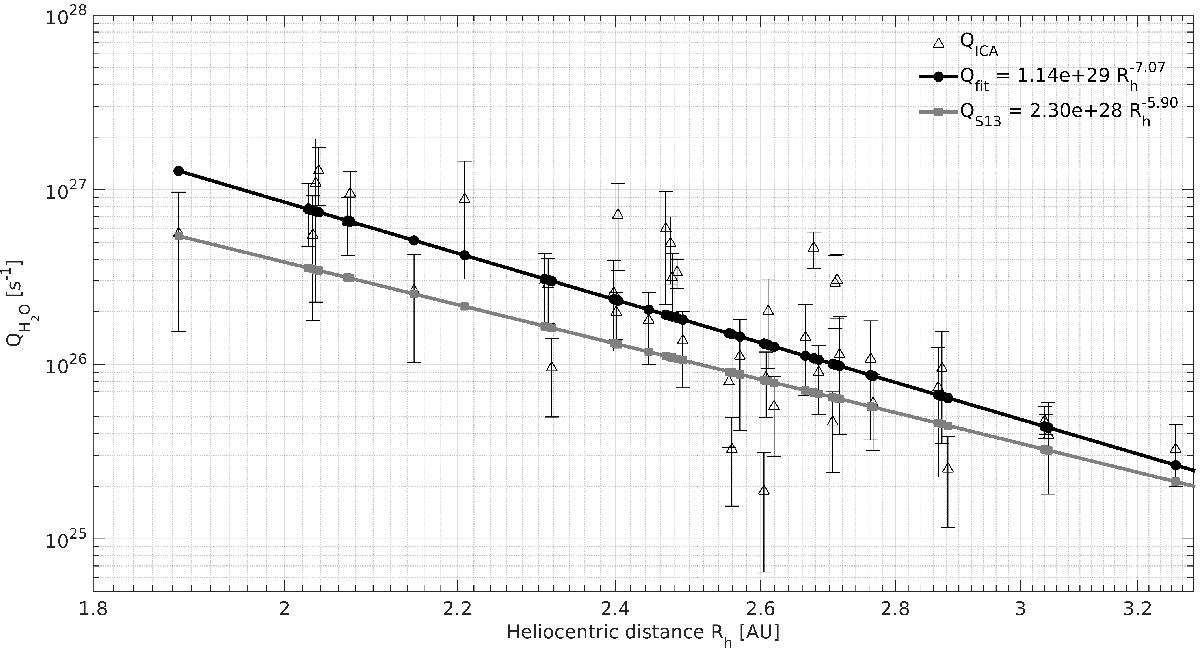
Fig. 10

Outgassing rates Q derived from RPC-ICA as a function of heliocentric distance Rh, assuming a constant outgassing velocity of 700 m s-1. A least-squares fit is performed on the data (black solid line, Qfit) and compared to the previous measurements of Snodgrass et al. (2013; grey solid lines, QS13). This is a log 10−log 10 plot i.e., the x-axis is also logarithmically spaced.
Current usage metrics show cumulative count of Article Views (full-text article views including HTML views, PDF and ePub downloads, according to the available data) and Abstracts Views on Vision4Press platform.
Data correspond to usage on the plateform after 2015. The current usage metrics is available 48-96 hours after online publication and is updated daily on week days.
Initial download of the metrics may take a while.


