Fig. 3
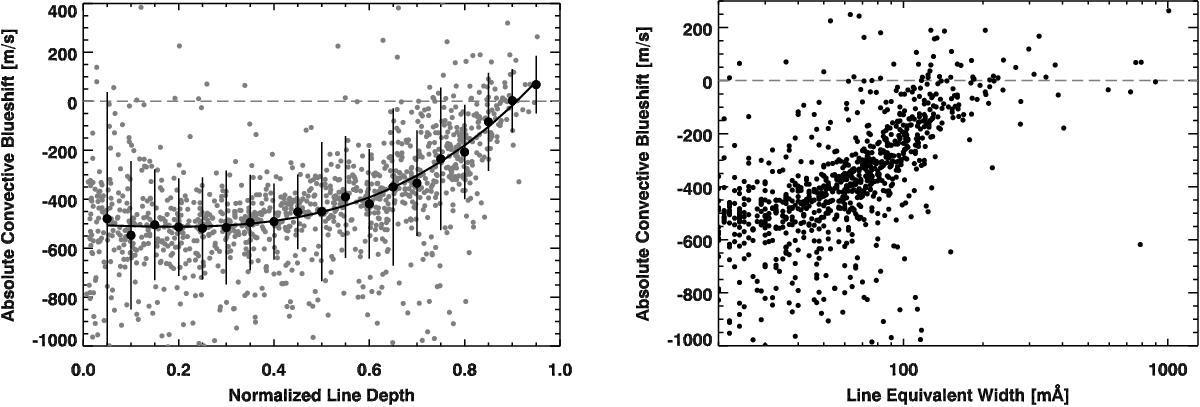
Absolute convective blueshift of Fe i lines measured from the IAG atlas. Left: blueshift measurements for individual lines (gray points) as a function of line depth. The measurements are corrected for gravitational redshift of 636 m s-1. The median of the blueshift measurements is shown in bins of size 0.05; the error bars show the standard deviation for each bin. A third-order polynomial (Eq. (2)) is fit to the binned data. Right: blueshift measurements as a function of line equivalent width as measured by Allende Prieto & Garcia Lopez (1998).
Current usage metrics show cumulative count of Article Views (full-text article views including HTML views, PDF and ePub downloads, according to the available data) and Abstracts Views on Vision4Press platform.
Data correspond to usage on the plateform after 2015. The current usage metrics is available 48-96 hours after online publication and is updated daily on week days.
Initial download of the metrics may take a while.