Fig. 1
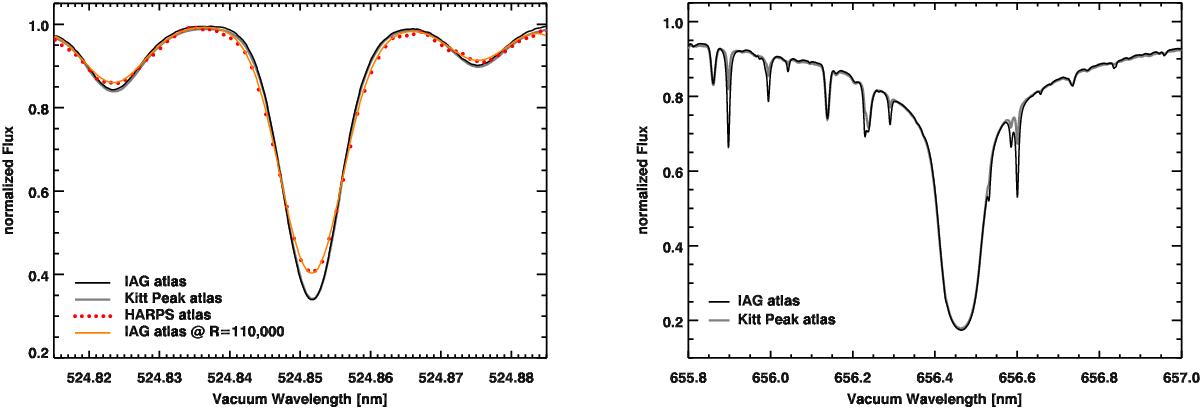
Comparison of the IAG spectral atlas with the Kitt Peak FTS-atlas from Kurucz et al. (1984) and the HARPS atlas from Molaro et al. (2013). Left: three absorption lines around 524.85 nm. To allow comparison to the HARPS atlas, the IAG atlas was artificially broadened using a Gaussian profile and assuming an instrument resolution of R = 110 000. Right: comparison in the wavelength range of Hα. The sharp lines are telluric absorption and mismatch because of different observing conditions. The HARPS atlas does not cover this spectral region.
Current usage metrics show cumulative count of Article Views (full-text article views including HTML views, PDF and ePub downloads, according to the available data) and Abstracts Views on Vision4Press platform.
Data correspond to usage on the plateform after 2015. The current usage metrics is available 48-96 hours after online publication and is updated daily on week days.
Initial download of the metrics may take a while.