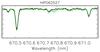
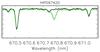
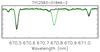
Fig. 2
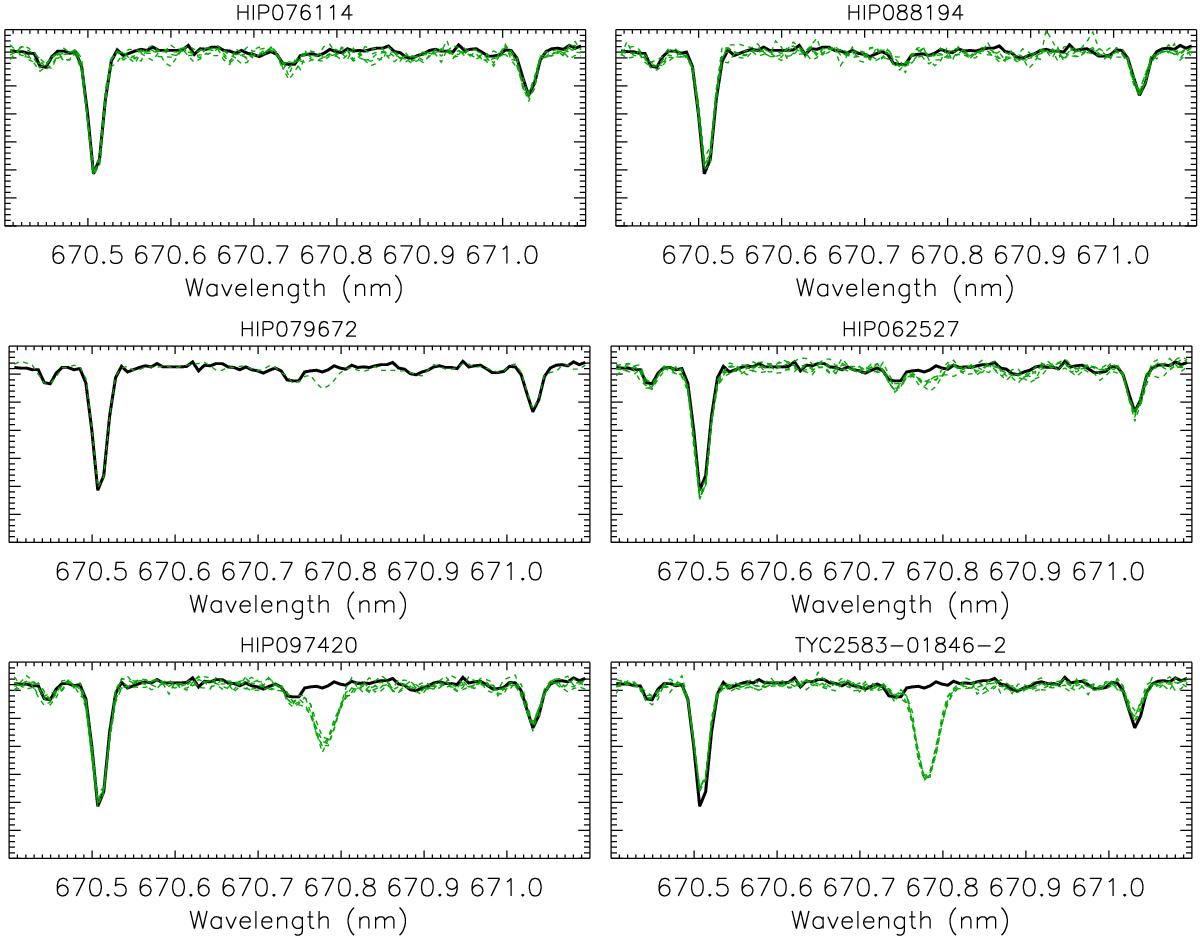
Comparison of the spectral range centred on the 670.78 nm Li feature in one of the Sun spectra (black thick line) and a target (green dashed line) with up to five spectra available for some stars. The upper panels show two stars classified as A (the same Li deficiency as the Sun), the middle panels show two stars classified as B (slightly more abundant in Li than the Sun), the bottom panels show two stars classified as C (pronounced Li feature).
Current usage metrics show cumulative count of Article Views (full-text article views including HTML views, PDF and ePub downloads, according to the available data) and Abstracts Views on Vision4Press platform.
Data correspond to usage on the plateform after 2015. The current usage metrics is available 48-96 hours after online publication and is updated daily on week days.
Initial download of the metrics may take a while.