Fig. 1
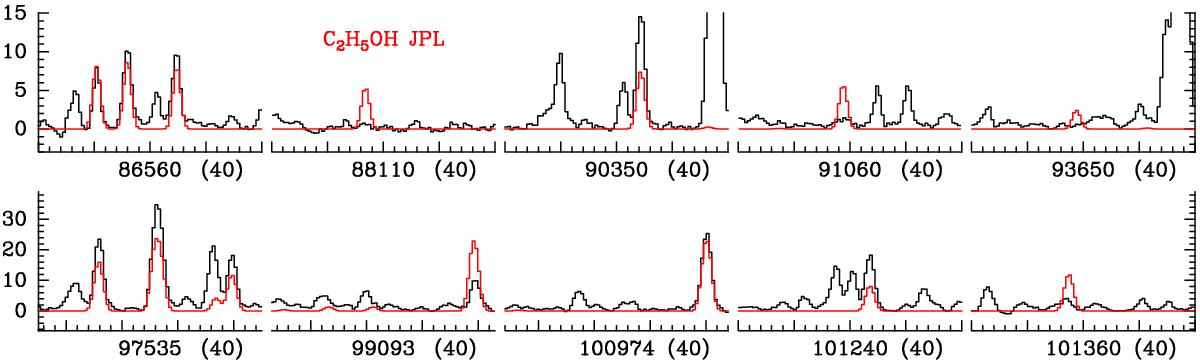
Sections of the continuum-subtracted spectrum recorded with ALMA toward Sgr B2(N2) in black. The synthetic spectrum of ethanol using the official JPL catalog entry is shown in red. Some lines are predicted to be much stronger than they appear in the spectrum, e.g., near 88 107 MHz and 91 059 MHz. A few other lines, e.g., near 90 354 MHz and 101 244 MHz, are stronger than predicted. Compare with Fig. 2. The central frequency of each panel is indicated below the x-axis in MHz; its width is given also in MHz in parentheses. The y-axis is labeled in brightness temperature units (K).
Current usage metrics show cumulative count of Article Views (full-text article views including HTML views, PDF and ePub downloads, according to the available data) and Abstracts Views on Vision4Press platform.
Data correspond to usage on the plateform after 2015. The current usage metrics is available 48-96 hours after online publication and is updated daily on week days.
Initial download of the metrics may take a while.