Fig. 4
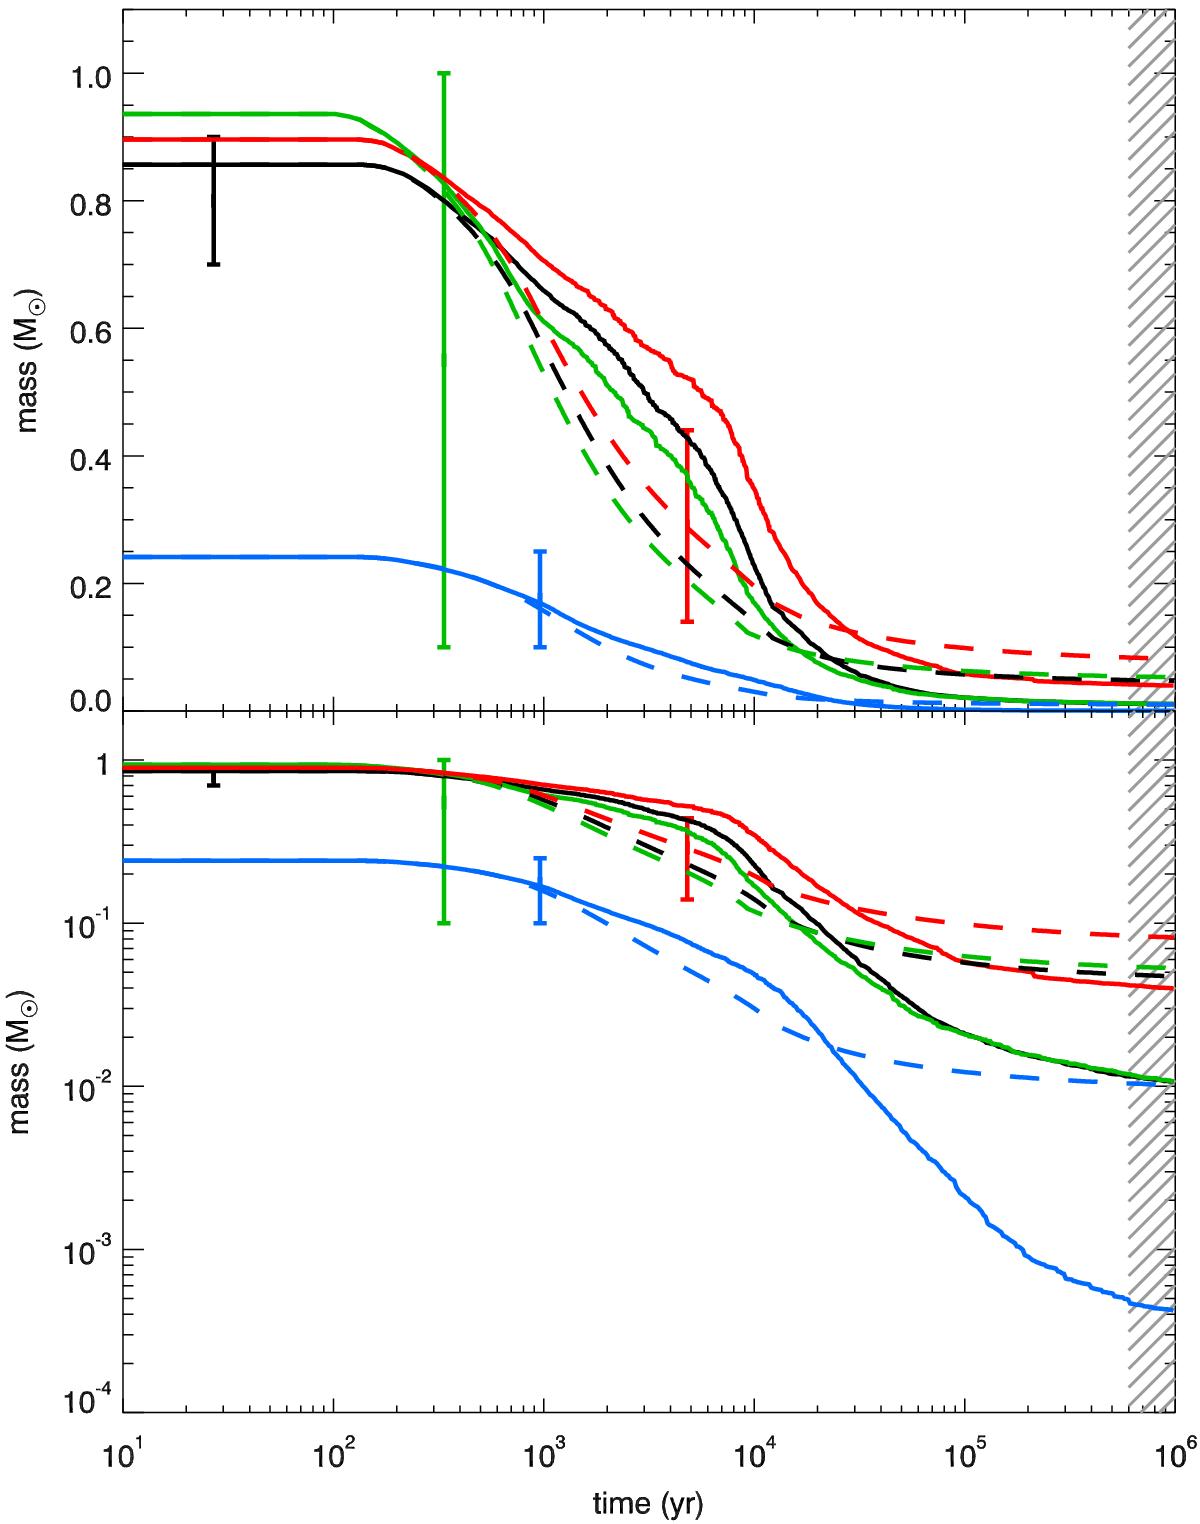
Dust mass evolution as a function of time for the four SNe considered in this study (1987A: black, CasA: green, Crab: blue, and N49: red). Solid lines represent GRASH_Rev results and dashed lines the results obtained by BS07 model using the same initial conditions. Data points represent the observed dust masses, and the shaded region indicate the time interval when dust processing fades out.
Current usage metrics show cumulative count of Article Views (full-text article views including HTML views, PDF and ePub downloads, according to the available data) and Abstracts Views on Vision4Press platform.
Data correspond to usage on the plateform after 2015. The current usage metrics is available 48-96 hours after online publication and is updated daily on week days.
Initial download of the metrics may take a while.