Fig. 1
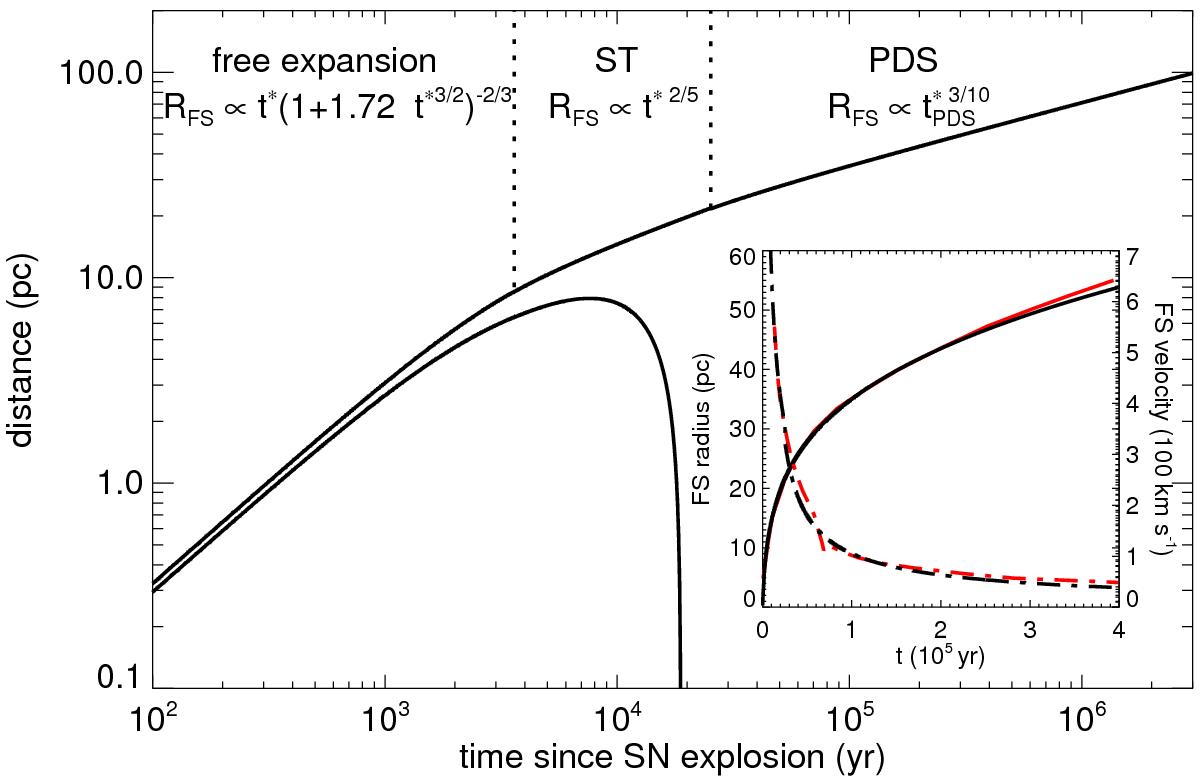
Position of the forward and reverse shocks (black lines) as a function of time from the ED phase through the PDS phase. In the inset we compare the position (solid line) and velocity (dot-dashed lines) of the forward shock computed using the analytical solution (black lines) with the simulation by Slavin et al. (2015; red lines).
Current usage metrics show cumulative count of Article Views (full-text article views including HTML views, PDF and ePub downloads, according to the available data) and Abstracts Views on Vision4Press platform.
Data correspond to usage on the plateform after 2015. The current usage metrics is available 48-96 hours after online publication and is updated daily on week days.
Initial download of the metrics may take a while.