Fig. 7
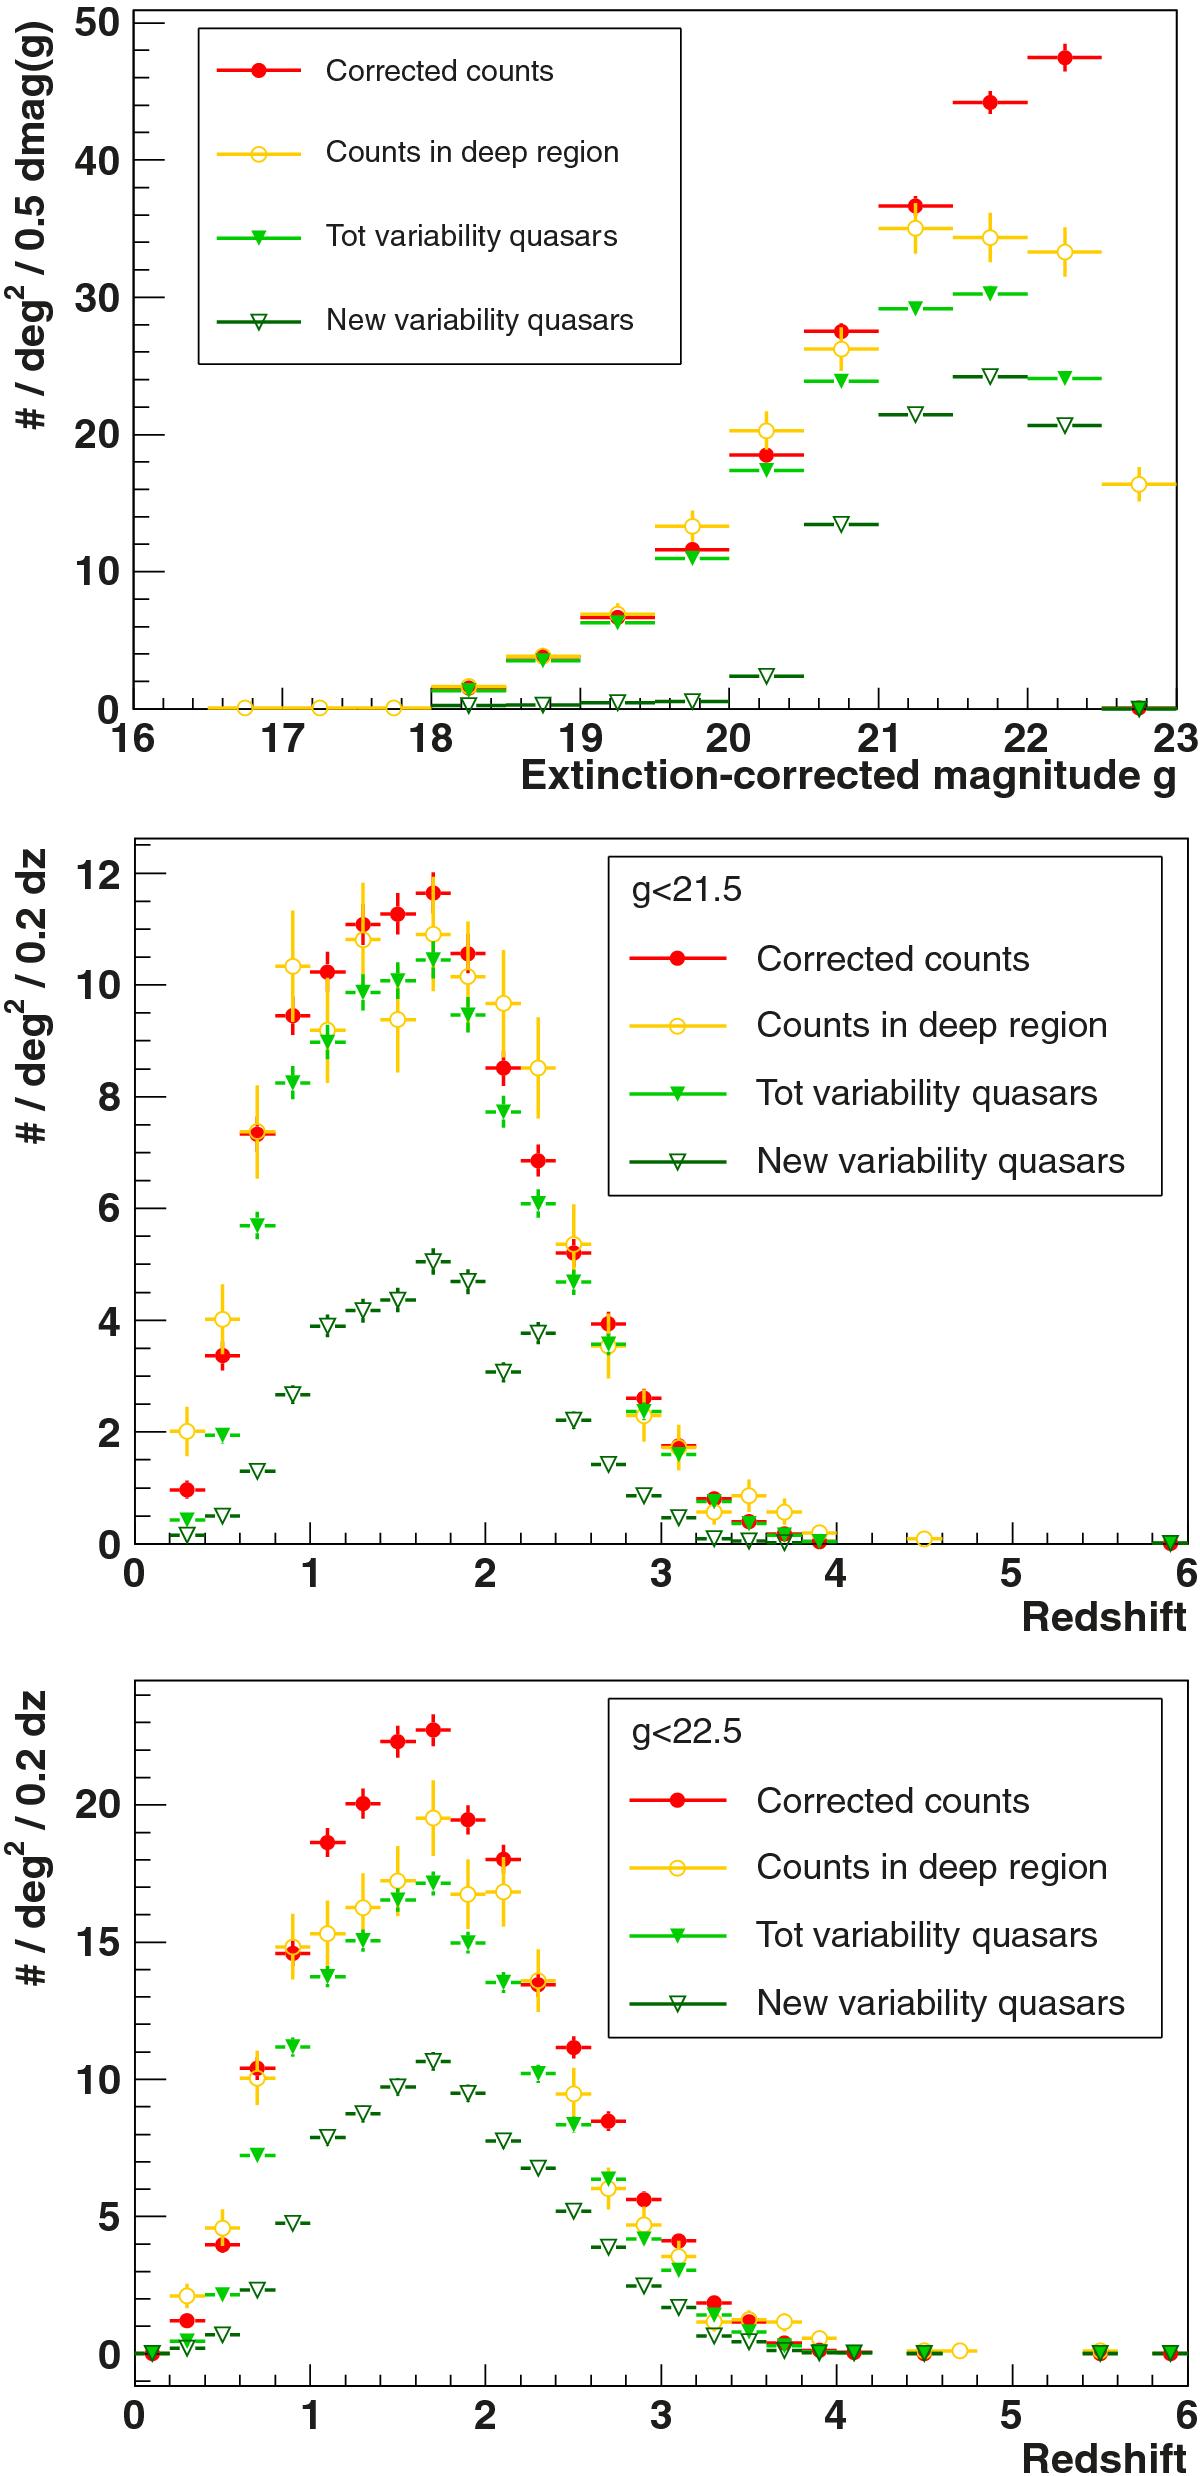
Extinction-corrected magnitude (top) and redshift (middle and bottom) distributions. At faint magnitudes, most variability-selected sample (green triangles) comes from the newly identified quasars (open dark green triangles). The deep sample (orange circles) from the 36°<α< 42° zone (cf. Sect. 3.3) reproduces the corrected counts well (plain red circles) to g = 21.5, validating the computation of the completeness corrections to this magnitude limit. The deep sample is the only one to extend beyond g = 22.5.
Current usage metrics show cumulative count of Article Views (full-text article views including HTML views, PDF and ePub downloads, according to the available data) and Abstracts Views on Vision4Press platform.
Data correspond to usage on the plateform after 2015. The current usage metrics is available 48-96 hours after online publication and is updated daily on week days.
Initial download of the metrics may take a while.